US Airways 2009 Annual Report Download - page 48
Download and view the complete annual report
Please find page 48 of the 2009 US Airways annual report below. You can navigate through the pages in the report by either clicking on the pages listed below, or by using the keyword search tool below to find specific information within the annual report.-
 1
1 -
2
-
3
-
4
-
5
-
6
-
7
-
8
-
9
-
10
-
11
-
12
-
13
-
14
-
15
-
16
-
17
-
18
-
19
-
20
-
21
-
22
-
23
-
24
-
25
-
26
-
27
-
28
-
29
-
30
-
31
-
32
-
33
-
34
-
35
-
36
-
37
-
 38
38 -
 39
39 -
 40
40 -
 41
41 -
 42
42 -
 43
43 -
 44
44 -
 45
45 -
 46
46 -
 47
47 -
 48
48 -
 49
49 -
 50
50 -
 51
51 -
 52
52 -
 53
53 -
 54
54 -
 55
55 -
 56
56 -
 57
57 -
 58
58 -
59
-
60
-
61
-
62
-
63
-
64
-
65
-
66
-
67
-
68
-
69
-
70
-
71
-
72
-
73
-
74
-
75
-
76
-
77
-
78
-
79
-
80
-
81
-
82
-
83
-
84
-
85
-
86
-
87
-
88
-
89
-
90
-
91
-
92
-
93
-
94
-
95
-
96
-
97
-
98
-
99
-
100
-
101
-
102
-
103
-
104
-
105
-
106
-
107
-
108
-
109
-
110
-
111
-
112
-
113
-
114
-
115
-
116
-
117
-
118
-
119
-
120
-
121
-
122
-
123
-
124
-
125
-
126
-
127
-
128
-
129
-
130
-
131
-
132
-
133
-
134
-
135
-
136
-
137
-
138
-
139
-
140
-
141
-
142
-
143
-
144
-
145
-
146
-
147
-
148
-
149
-
150
-
151
-
152
-
153
-
154
-
155
-
156
-
157
-
158
-
159
-
160
-
161
-
162
-
163
-
164
-
165
-
166
-
167
-
168
-
169
-
170
-
171
-
172
-
173
-
174
-
175
-
176
-
177
-
178
-
179
-
180
-
181
-
182
-
183
-
184
-
185
-
186
-
187
-
188
-
189
-
190
-
191
-
192
-
193
-
194
-
195
-
196
-
197
-
198
-
199
-
200
-
201
-
202
-
203
-
204
-
205
-
206
-
207
-
208
-
209
-
210
-
211
 |
 |
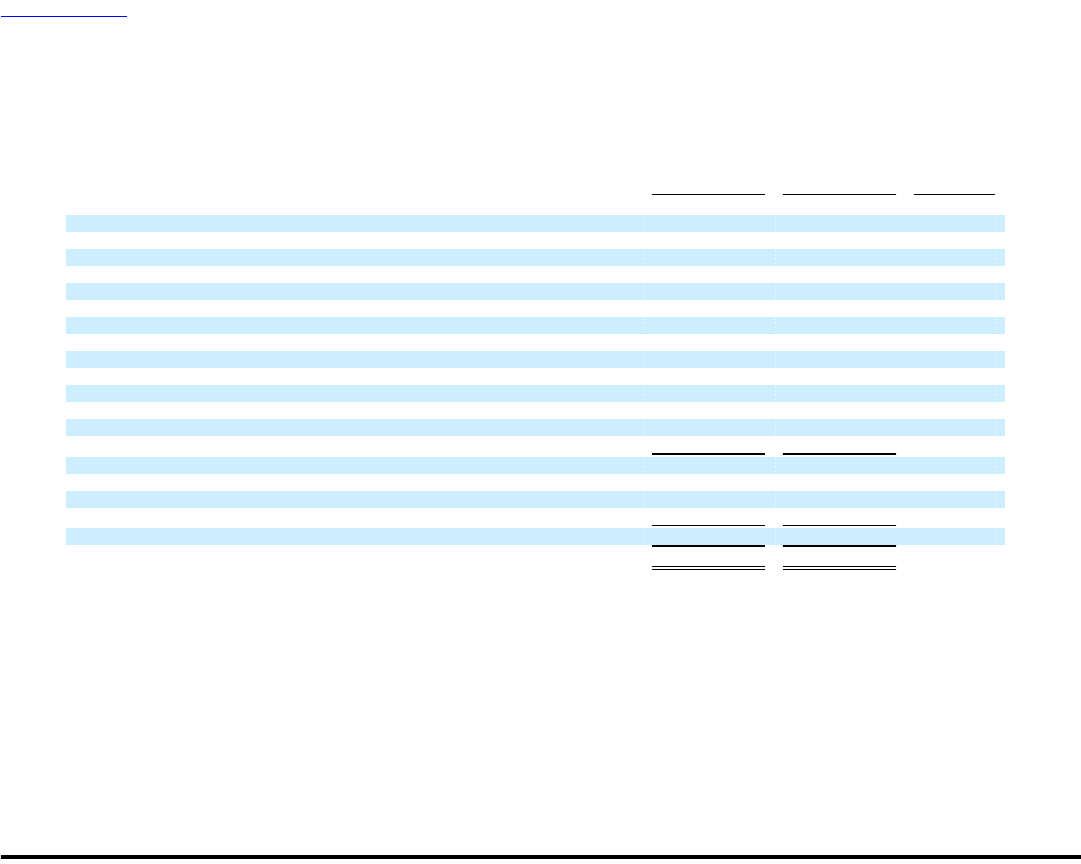
Table of Contents
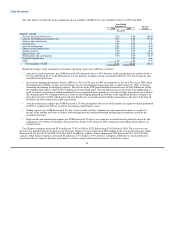
• Other revenues were $912 million in 2008, an increase of $183 million from 2007 primarily due to our new revenue initiatives,
principally our first and second checked bag fees, which were implemented in the second and third quarters of 2008.
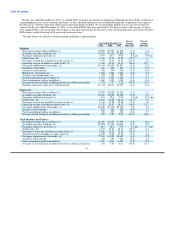
Operating Expenses:
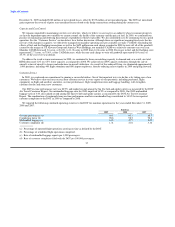
Percent
2008 2007 Change
(In millions)
Operating expenses:
Aircraft fuel and related taxes $ 3,618 $ 2,630 37.6
Loss (gain) on fuel hedging instruments, net:
Realized (140) (58) nm
Unrealized 496 (187) nm
Salaries and related costs 2,231 2,302 (3.1)
Aircraft rent 724 727 (0.4)
Aircraft maintenance 783 635 23.2
Other rent and landing fees 562 536 4.9
Selling expenses 439 453 (3.2)
Special items, net 76 99 (23.2)
Depreciation and amortization 215 189 13.7
Goodwill impairment 622 — nm
Other 1,243 1,247 (0.2)
Total mainline operating expenses 10,869 8,573 26.8
Express expenses:
Fuel 1,137 765 48.6
Other 1,912 1,829 4.5
Total Express operating expense 3,049 2,594 17.5
Total operating expenses $ 13,918 $ 11,167 24.6
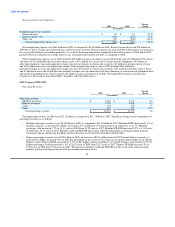
Total operating expenses were $13.92 billion in 2008, an increase of $2.75 billion or 24.6% compared to 2007. Mainline operating
expenses were $10.87 billion in 2008, an increase of $2.3 billion or 26.8% from 2007, while ASMs decreased 2.2%.
Mainline CASM increased 29.7% to 14.66 cents in 2008 from 11.3 cents in 2007. The 2008 period included a $622 million non-cash
charge to write off all of the goodwill created by the merger of US Airways Group and America West Holdings in September 2005,
which contributed 0.84 cents to our mainline CASM for 2008. The remaining period-over-period increase in CASM was driven
principally by increases in aircraft fuel costs ($988 million or 1.41 cents per ASM) and a net loss on fuel hedging instruments
($356 million) in 2008 compared to a net gain ($245 million) in 2007, which accounted for 0.8 cents per ASM.
The 2008 period also included $76 million of net special charges, consisting of $35 million of merger-related transition expenses,
$18 million in non-cash charges related to the decline in fair value of certain spare parts associated with our Boeing 737 aircraft fleet and,
as a result of our capacity reductions, $14 million in aircraft costs and $9 million in severance charges. This compares to net special
charges of $99 million in the 2007 period due to merger-related transition expenses.
46