US Airways 2009 Annual Report Download - page 87
Download and view the complete annual report
Please find page 87 of the 2009 US Airways annual report below. You can navigate through the pages in the report by either clicking on the pages listed below, or by using the keyword search tool below to find specific information within the annual report.-
 1
1 -
2
-
3
-
4
-
5
-
6
-
7
-
8
-
9
-
10
-
11
-
12
-
13
-
14
-
15
-
16
-
17
-
18
-
19
-
20
-
21
-
22
-
23
-
24
-
25
-
26
-
27
-
28
-
29
-
30
-
31
-
32
-
33
-
34
-
35
-
36
-
37
-
38
-
39
-
40
-
41
-
42
-
43
-
44
-
45
-
46
-
47
-
48
-
49
-
50
-
51
-
52
-
53
-
54
-
55
-
56
-
57
-
58
-
59
-
60
-
61
-
62
-
63
-
64
-
65
-
66
-
67
-
68
-
69
-
70
-
71
-
72
-
73
-
74
-
75
-
76
-
 77
77 -
 78
78 -
 79
79 -
 80
80 -
 81
81 -
 82
82 -
 83
83 -
 84
84 -
 85
85 -
 86
86 -
 87
87 -
 88
88 -
 89
89 -
 90
90 -
 91
91 -
 92
92 -
 93
93 -
 94
94 -
 95
95 -
 96
96 -
 97
97 -
98
-
99
-
100
-
101
-
102
-
103
-
104
-
105
-
106
-
107
-
108
-
109
-
110
-
111
-
112
-
113
-
114
-
115
-
116
-
117
-
118
-
119
-
120
-
121
-
122
-
123
-
124
-
125
-
126
-
127
-
128
-
129
-
130
-
131
-
132
-
133
-
134
-
135
-
136
-
137
-
138
-
139
-
140
-
141
-
142
-
143
-
144
-
145
-
146
-
147
-
148
-
149
-
150
-
151
-
152
-
153
-
154
-
155
-
156
-
157
-
158
-
159
-
160
-
161
-
162
-
163
-
164
-
165
-
166
-
167
-
168
-
169
-
170
-
171
-
172
-
173
-
174
-
175
-
176
-
177
-
178
-
179
-
180
-
181
-
182
-
183
-
184
-
185
-
186
-
187
-
188
-
189
-
190
-
191
-
192
-
193
-
194
-
195
-
196
-
197
-
198
-
199
-
200
-
201
-
202
-
203
-
204
-
205
-
206
-
207
-
208
-
209
-
210
-
211
 |
 |

Table of Contents
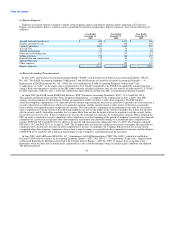
expenses included $12 million in uniform costs to transition employees to the new US Airways uniforms; $5 million in applicable
employment tax expenses related to contractual benefits granted to certain current and former employees as a result of the merger;
$6 million in compensation expenses for equity awards granted in connection with the merger to retain key employees through the
integration period; $5 million of aircraft livery costs; $4 million in professional and technical fees related to the integration of the
Company's airline operations systems and $3 million in other expenses.
In 2007, the Company incurred $99 million of merger-related transition expenses. These expenses included $13 million in training and
related expenses; $19 million in compensation expenses for equity awards granted in connection with the merger to retain key employees
through the integration period; $20 million of aircraft livery costs; $37 million in professional and technical fees related to the integration
of the Company's airline operations systems; $1 million in employee moving expenses; $4 million related to reservation system migration
expenses and $5 million of other expenses.
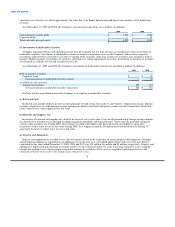
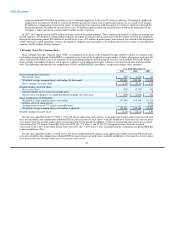
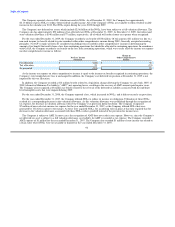
3. Earnings (Loss) Per Common Share
Basic earnings (loss) per common share ("EPS") is computed on the basis of the weighted average number of shares of common stock
outstanding during the period. Diluted EPS is computed on the basis of the weighted average number of shares of common stock plus the
effect of potentially dilutive shares of common stock outstanding during the period using the treasury stock method. Potentially dilutive
shares include outstanding employee stock options, employee stock appreciation rights, employee restricted stock units and convertible
debt. The following table presents the computation of basic and diluted EPS (in millions, except share and per share amounts):
Year Ended December 31,
2009 2008 2007
Basic earnings (loss) per share:
Net income (loss) $ (205) $ (2,215) $ 423
Weighted average common shares outstanding (in thousands) 133,000 100,168 91,536
Basic earnings (loss) per share $ (1.54) $ (22.11) $ 4.62
Diluted earnings (loss) per share:
Net income (loss) (205) (2,215) 423
Interest expense on 7% senior convertible notes — — 9
Income (loss) for purposes of computing diluted earnings (loss) per share $ (205) $ (2,215) $ 432
Share computation (in thousands):
Weighted average common shares outstanding 133,000 100,168 91,536
Dilutive effect of stock awards — — 1,017
Assumed conversion of 7% senior convertible notes — — 3,050
Weighted average common shares outstanding as adjusted 133,000 100,168 95,603
Diluted earnings (loss) per share: $ (1.54) $ (22.11) $ 4.52
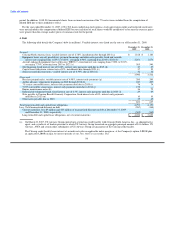
For the year ended December 31, 2009, 11,479,742 shares underlying stock options, stock appreciation rights and restricted stock units
were not included in the computation of diluted EPS because inclusion of such shares would be antidilutive or because the exercise prices
were greater than the average market price of common stock for the period. In addition, 3,048,914 incremental shares from the assumed
conversion of the 7% Senior Convertible Notes due 2020 (the "7% notes") and 23,954,303 incremental shares from the assumed
conversion of the 7.25% Convertible Senior Notes due 2014 (the "7.25% notes") were excluded from the computation of diluted EPS due
to their antidilutive effect.
For the year ended December 31, 2008, 8,181,340 shares underlying stock options, stock appreciation rights and restricted stock units
were not included in the computation of diluted EPS because inclusion of such shares would be antidilutive or because the exercise prices
were greater than the average market price of common stock for the
85