US Airways 2009 Annual Report Download - page 38
Download and view the complete annual report
Please find page 38 of the 2009 US Airways annual report below. You can navigate through the pages in the report by either clicking on the pages listed below, or by using the keyword search tool below to find specific information within the annual report.-
 1
1 -
2
-
3
-
4
-
5
-
6
-
7
-
8
-
9
-
10
-
11
-
12
-
13
-
14
-
15
-
16
-
17
-
18
-
19
-
20
-
21
-
22
-
23
-
24
-
25
-
26
-
27
-
 28
28 -
 29
29 -
 30
30 -
 31
31 -
 32
32 -
 33
33 -
 34
34 -
 35
35 -
 36
36 -
 37
37 -
 38
38 -
 39
39 -
 40
40 -
 41
41 -
 42
42 -
 43
43 -
 44
44 -
 45
45 -
 46
46 -
 47
47 -
 48
48 -
49
-
50
-
51
-
52
-
53
-
54
-
55
-
56
-
57
-
58
-
59
-
60
-
61
-
62
-
63
-
64
-
65
-
66
-
67
-
68
-
69
-
70
-
71
-
72
-
73
-
74
-
75
-
76
-
77
-
78
-
79
-
80
-
81
-
82
-
83
-
84
-
85
-
86
-
87
-
88
-
89
-
90
-
91
-
92
-
93
-
94
-
95
-
96
-
97
-
98
-
99
-
100
-
101
-
102
-
103
-
104
-
105
-
106
-
107
-
108
-
109
-
110
-
111
-
112
-
113
-
114
-
115
-
116
-
117
-
118
-
119
-
120
-
121
-
122
-
123
-
124
-
125
-
126
-
127
-
128
-
129
-
130
-
131
-
132
-
133
-
134
-
135
-
136
-
137
-
138
-
139
-
140
-
141
-
142
-
143
-
144
-
145
-
146
-
147
-
148
-
149
-
150
-
151
-
152
-
153
-
154
-
155
-
156
-
157
-
158
-
159
-
160
-
161
-
162
-
163
-
164
-
165
-
166
-
167
-
168
-
169
-
170
-
171
-
172
-
173
-
174
-
175
-
176
-
177
-
178
-
179
-
180
-
181
-
182
-
183
-
184
-
185
-
186
-
187
-
188
-
189
-
190
-
191
-
192
-
193
-
194
-
195
-
196
-
197
-
198
-
199
-
200
-
201
-
202
-
203
-
204
-
205
-
206
-
207
-
208
-
209
-
210
-
211
 |
 |

Table of Contents
the economic recession. ATA reported yields for U.S. airlines declined by 13% in 2009 as compared to 2008 while U.S. airline passenger
revenues were down 18% for fiscal year 2009, which represented the largest decline on record, exceeding the 14% decline observed from
2000 to 2001.
International markets were more severely impacted by the economic slowdown than domestic markets. This was a result of
international traffic's greater reliance on business travel, particularly premium business and first class seating, to drive profitability.
Additionally, there was capacity expansion overseas during the past several years, which the U.S. industry reduced by only 6% in 2009 as
compared to domestic capacity reductions of 7%. The contraction of business spending also significantly impacted cargo demand.
During times of weak travel demand, falling fuel prices have historically served as a natural hedge. Although the price of crude oil was
down substantially in 2009 from its record high of $147 per barrel in July 2008, it remained volatile and did not fully offset the negative
economic impact to passenger demand. During 2009, the price of crude oil on a per barrel basis ranged from a high of $81.03 to a low of
$34.03, and closed at $79.39 on December 31, 2009. The volatility in oil prices made the use of hedging positions by airlines to contain
fuel costs either expensive (call options) or risky due to counterparty cash collateral requirements (collars and swaps).
Accordingly, in 2009 the industry focused on conserving and building cash and matching capacity to demand. In the latter part of
2009, credit and equity markets were increasingly open to airlines and several U.S. airlines raised cash to enhance liquidity through a
number of initiatives such as traditional public stock and debt issuances, asset sales, asset sale-leasebacks and transactions with co-
branded credit card issuers.
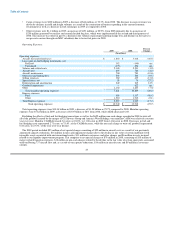
US Airways
Financial Results
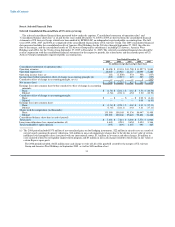
US Airways Group's net loss for 2009 was $205 million, or a loss of $1.54 per share, as compared to a net loss of $2.22 billion, or
$22.11 per share, in 2008. Similar to other carriers in the U.S. airline industry, we experienced significant declines in revenues as a result
of the global economic recession, which more than offset the benefits of reduced fuel costs during 2009.
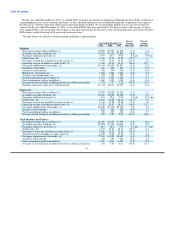
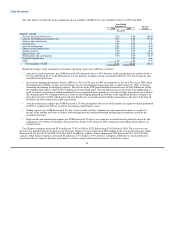
Revenue
The weak demand environment caused by the economic recession resulted in a $1.81 billion, or 16.3%, decrease in mainline and
Express passenger revenues in 2009 on lower capacity as compared to 2008. Our decline in passenger revenues was lower than the
U.S. industry average of 18% reported by ATA as relative to the other U.S. legacy or big five hub-and-spoke carriers, our larger domestic
presence meant our revenues were less exposed to the more adverse effects of the economic recession experienced in international
markets. Our international capacity represents approximately 22% of our total ASMs. The industry took more aggressive corrective
capacity reductions domestically than it did internationally in 2009.
Our revenues also benefited from our new revenue initiatives which generated $424 million in ancillary revenues for 2009. Given our
shorter length of haul and domestic focus, we believe these initiatives provided greater benefit to us than our competitors. Ancillary
revenues include first and second checked bag service fees, processing fees for travel awards issued through our Dividend Miles frequent
traveler program, our new Choice Seats program, and call center/airport ticketing fees. As a result of new ancillary revenues, while our
mainline and Express PRASM was 10.88 cents in 2009, a 12.4% decline as compared to 12.42 cents in 2008, our total revenue per
available seat mile ("RASM") declined by a lower amount. RASM was 12.29 cents in 2009, as compared to 13.6 cents in 2008,
representing only a 9.6% decline.
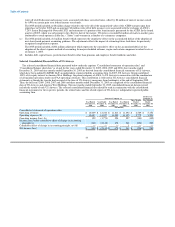
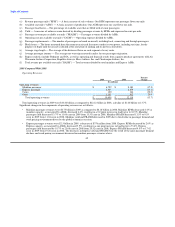
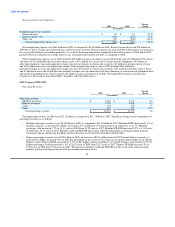
Fuel
The average mainline and Express price per gallon of fuel decreased 44.8% to $1.76 in 2009 from $3.18 in 2008. As a result, our
mainline and Express fuel expense for 2009 was $2.28 billion, or 48%, lower than the 2008 period on 4.5% lower capacity. Since the
third quarter of 2008, we have not entered into any new fuel hedging transactions and, as of December 31, 2009, we had no remaining
outstanding fuel hedging contracts. Net losses associated with fuel hedging transactions were $7 million in 2009, a decline of
$349 million from 2008. The year ended
36