US Airways 2009 Annual Report Download - page 46
Download and view the complete annual report
Please find page 46 of the 2009 US Airways annual report below. You can navigate through the pages in the report by either clicking on the pages listed below, or by using the keyword search tool below to find specific information within the annual report.-
 1
1 -
2
-
3
-
4
-
5
-
6
-
7
-
8
-
9
-
10
-
11
-
12
-
13
-
14
-
15
-
16
-
17
-
18
-
19
-
20
-
21
-
22
-
23
-
24
-
25
-
26
-
27
-
28
-
29
-
30
-
31
-
32
-
33
-
34
-
35
-
 36
36 -
 37
37 -
 38
38 -
 39
39 -
 40
40 -
 41
41 -
 42
42 -
 43
43 -
 44
44 -
 45
45 -
 46
46 -
 47
47 -
 48
48 -
 49
49 -
 50
50 -
 51
51 -
 52
52 -
 53
53 -
 54
54 -
 55
55 -
 56
56 -
57
-
58
-
59
-
60
-
61
-
62
-
63
-
64
-
65
-
66
-
67
-
68
-
69
-
70
-
71
-
72
-
73
-
74
-
75
-
76
-
77
-
78
-
79
-
80
-
81
-
82
-
83
-
84
-
85
-
86
-
87
-
88
-
89
-
90
-
91
-
92
-
93
-
94
-
95
-
96
-
97
-
98
-
99
-
100
-
101
-
102
-
103
-
104
-
105
-
106
-
107
-
108
-
109
-
110
-
111
-
112
-
113
-
114
-
115
-
116
-
117
-
118
-
119
-
120
-
121
-
122
-
123
-
124
-
125
-
126
-
127
-
128
-
129
-
130
-
131
-
132
-
133
-
134
-
135
-
136
-
137
-
138
-
139
-
140
-
141
-
142
-
143
-
144
-
145
-
146
-
147
-
148
-
149
-
150
-
151
-
152
-
153
-
154
-
155
-
156
-
157
-
158
-
159
-
160
-
161
-
162
-
163
-
164
-
165
-
166
-
167
-
168
-
169
-
170
-
171
-
172
-
173
-
174
-
175
-
176
-
177
-
178
-
179
-
180
-
181
-
182
-
183
-
184
-
185
-
186
-
187
-
188
-
189
-
190
-
191
-
192
-
193
-
194
-
195
-
196
-
197
-
198
-
199
-
200
-
201
-
202
-
203
-
204
-
205
-
206
-
207
-
208
-
209
-
210
-
211
 |
 |

Table of Contents
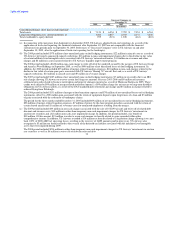
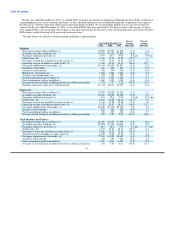
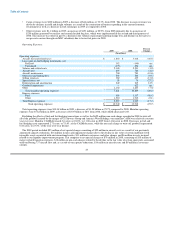
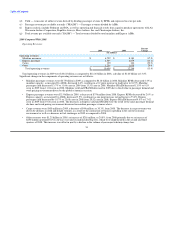
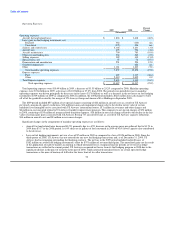
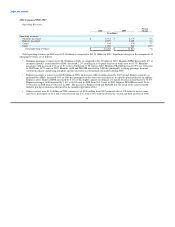
The table below sets forth the major components of our mainline CASM for the years ended December 31, 2009 and 2008:
Year Ended
December 31, Percent
2009 2008 Change
(In cents)
Mainline CASM:
Aircraft fuel and related taxes 2.64 4.88 (46.0)
Loss on fuel hedging instruments, net 0.01 0.48 (97.8)
Salaries and related costs 3.06 3.01 1.7
Aircraft rent 0.98 0.98 0.7
Aircraft maintenance 0.99 1.05 (6.2)
Other rent and landing fees 0.79 0.76 4.4
Selling expenses 0.54 0.59 (8.8)
Special items, net 0.08 0.10 (23.8)
Depreciation and amortization 0.34 0.29 18.0
Goodwill impairment — 0.84 nm
Other 1.63 1.68 (2.9)
Total mainline CASM 11.06 14.66 (24.6)
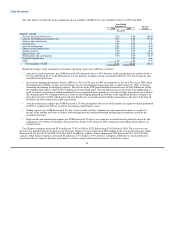
Significant changes in the components of mainline operating expense per ASM are as follows:
• Aircraft fuel and related taxes per ASM decreased 46% primarily due to a 45% decrease in the average price per gallon of fuel to
$1.74 in 2009 from $3.17 in the 2008 period. A 6.4% decrease in gallons of fuel consumed in 2009 on 4.6% lower capacity also
contributed to the decrease.
• Loss on fuel hedging instruments, net per ASM was a loss of 0.01 cent in 2009 as compared to a loss of 0.48 cents in 2008. Since
the third quarter of 2008, we have not entered into any new fuel hedging transactions and, as of December 31, 2009, we had no
remaining outstanding fuel hedging contracts. The net loss in the 2009 period included realized losses of $382 million on settled
fuel hedging instruments, offset by $375 million of net unrealized gains. The unrealized gains are the result of the application of
mark-to-market accounting in which unrealized losses recognized in prior periods are reversed as hedge transactions are settled in
the current period. We recognized net losses from our fuel hedging program in 2008 due to the significant decline in the price of
oil in the latter part of 2008, which generated unrealized losses on certain open fuel hedge transactions as the price of heating oil
fell below the lower limit of our collar transactions.
• Aircraft maintenance expense per ASM decreased 6.2% due principally to decreases in the number of engine overhauls performed
in 2009 as compared to 2008 as a result of the timing of maintenance cycles.
• Selling expenses per ASM decreased 8.8% due to lower credit card fees, booking fees and commissions paid as a result of a
decline in the number and value of tickets sold resulting from the weakened demand and pricing environment caused by the
economic recession.
• Depreciation and amortization expense per ASM increased 18% due to a net increase in owned aircraft, primarily driven by the
acquisition of 19 Airbus A320 family aircraft and two Airbus A330 aircraft in 2009, which increased depreciation expense on
owned aircraft.
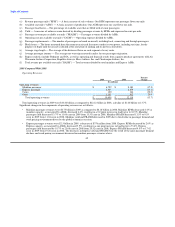
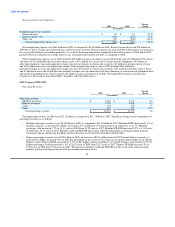
Total Express expenses decreased $530 million or 17.4% in 2009 to $2.52 billion from $3.05 billion in 2008. The year-over-year
decrease was primarily driven by decreases in fuel costs. Express fuel costs decreased $528 million as the average fuel price per gallon
decreased 44.3% from $3.23 in 2008 to $1.80 in 2009. In addition, gallons of fuel consumed in 2009 decreased 3.8% on 3.9% lower
capacity. Other Express expenses decreased $2 million or 0.1% despite a 3.9% decrease in Express ASMs due to certain fixed costs
associated with our capacity purchase agreements as well as certain contractual rate increases with these carriers.
44