US Airways 2009 Annual Report Download - page 45
Download and view the complete annual report
Please find page 45 of the 2009 US Airways annual report below. You can navigate through the pages in the report by either clicking on the pages listed below, or by using the keyword search tool below to find specific information within the annual report.-
 1
1 -
2
-
3
-
4
-
5
-
6
-
7
-
8
-
9
-
10
-
11
-
12
-
13
-
14
-
15
-
16
-
17
-
18
-
19
-
20
-
21
-
22
-
23
-
24
-
25
-
26
-
27
-
28
-
29
-
30
-
31
-
32
-
33
-
34
-
 35
35 -
 36
36 -
 37
37 -
 38
38 -
 39
39 -
 40
40 -
 41
41 -
 42
42 -
 43
43 -
 44
44 -
 45
45 -
 46
46 -
 47
47 -
 48
48 -
 49
49 -
 50
50 -
 51
51 -
 52
52 -
 53
53 -
 54
54 -
 55
55 -
56
-
57
-
58
-
59
-
60
-
61
-
62
-
63
-
64
-
65
-
66
-
67
-
68
-
69
-
70
-
71
-
72
-
73
-
74
-
75
-
76
-
77
-
78
-
79
-
80
-
81
-
82
-
83
-
84
-
85
-
86
-
87
-
88
-
89
-
90
-
91
-
92
-
93
-
94
-
95
-
96
-
97
-
98
-
99
-
100
-
101
-
102
-
103
-
104
-
105
-
106
-
107
-
108
-
109
-
110
-
111
-
112
-
113
-
114
-
115
-
116
-
117
-
118
-
119
-
120
-
121
-
122
-
123
-
124
-
125
-
126
-
127
-
128
-
129
-
130
-
131
-
132
-
133
-
134
-
135
-
136
-
137
-
138
-
139
-
140
-
141
-
142
-
143
-
144
-
145
-
146
-
147
-
148
-
149
-
150
-
151
-
152
-
153
-
154
-
155
-
156
-
157
-
158
-
159
-
160
-
161
-
162
-
163
-
164
-
165
-
166
-
167
-
168
-
169
-
170
-
171
-
172
-
173
-
174
-
175
-
176
-
177
-
178
-
179
-
180
-
181
-
182
-
183
-
184
-
185
-
186
-
187
-
188
-
189
-
190
-
191
-
192
-
193
-
194
-
195
-
196
-
197
-
198
-
199
-
200
-
201
-
202
-
203
-
204
-
205
-
206
-
207
-
208
-
209
-
210
-
211
 |
 |

Table of Contents
• Cargo revenues were $100 million in 2009, a decrease of $44 million, or 30.3%, from 2008. The decrease in cargo revenues was
driven by declines in yield and freight volumes as a result of the contraction of business spending in the current economic
environment as well as a decrease in fuel surcharges in 2009 as compared to 2008.
• Other revenues were $1.1 billion in 2009, an increase of $191 million, or 20.9%, from 2008 primarily due to an increase of
$250 million generated by our first and second checked bag fees, which were implemented in the second and third quarters of
2008. This increase was offset in part by a decline in the volume of passenger ticketing change fees and declines in fuel sales to
our pro-rate carriers through our MSC subsidiary due to lower fuel prices in 2009.
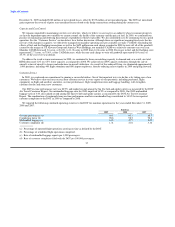
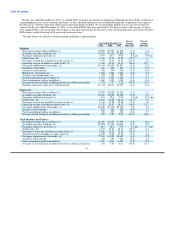
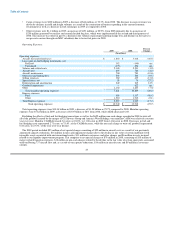
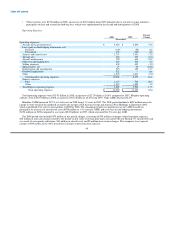
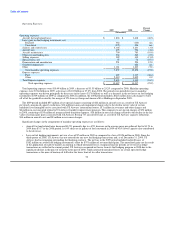
Operating Expenses:
Percent
2009 2008 Change
(In millions)
Operating expenses:
Aircraft fuel and related taxes $ 1,863 $ 3,618 (48.5)
Loss (gain) on fuel hedging instruments, net:
Realized 382 (140) nm
Unrealized (375) 496 nm
Salaries and related costs 2,165 2,231 (3.0)
Aircraft rent 695 724 (4.0)
Aircraft maintenance 700 783 (10.6)
Other rent and landing fees 560 562 (0.5)
Selling expenses 382 439 (13.0)
Special items, net 55 76 (27.3)
Depreciation and amortization 242 215 12.5
Goodwill impairment — 622 nm
Other 1,152 1,243 (7.4)
Total mainline operating expenses 7,821 10,869 (28.0)
Express expenses:
Fuel 609 1,137 (46.4)
Other 1,910 1,912 (0.1)
Total Express expenses 2,519 3,049 (17.4)
Total operating expenses $ 10,340 $ 13,918 (25.7)
Total operating expenses were $10.34 billion in 2009, a decrease of $3.58 billion or 25.7% compared to 2008. Mainline operating
expenses were $7.82 billion in 2009, a decrease of $3.05 billion or 28% from 2008, while ASMs decreased 4.6%.
Excluding the effects of fuel and fuel hedging transactions as well as the $622 million non-cash charge recorded in 2008 to write off
all of the goodwill created by the merger of US Airways Group and America West Holdings, our mainline CASM was relatively constant
year over year. Mainline CASM decreased 3.6 cents, or 24.6%, to 11.06 cents in 2009 from 14.66 cents in 2008. Decreases in fuel and
fuel hedging costs represented 2.71 cents, or 75.4%, of the CASM decrease, while the non-cash charge to write off goodwill represented
0.84 cents, or 23.3%, of the year-over-year decline.
The 2009 period included $55 million of net special charges consisting of $22 million in aircraft costs as a result of our previously
announced capacity reductions, $16 million in non-cash impairment charges due to the decline in fair value of certain indefinite lived
intangible assets associated with our international routes, $11 million in severance and other charges and $6 million in costs incurred
related to our liquidity improvement program. This compares to net special charges of $76 million in 2008, consisting of $35 million of
merger-related transition expenses, $18 million in non-cash charges related to the decline in the fair value of certain spare parts associated
with our Boeing 737 aircraft fleet and, as a result of our capacity reductions, $14 million in aircraft costs and $9 million in severance
charges.
43