US Airways 2009 Annual Report Download - page 78
Download and view the complete annual report
Please find page 78 of the 2009 US Airways annual report below. You can navigate through the pages in the report by either clicking on the pages listed below, or by using the keyword search tool below to find specific information within the annual report.-
 1
1 -
2
-
3
-
4
-
5
-
6
-
7
-
8
-
9
-
10
-
11
-
12
-
13
-
14
-
15
-
16
-
17
-
18
-
19
-
20
-
21
-
22
-
23
-
24
-
25
-
26
-
27
-
28
-
29
-
30
-
31
-
32
-
33
-
34
-
35
-
36
-
37
-
38
-
39
-
40
-
41
-
42
-
43
-
44
-
45
-
46
-
47
-
48
-
49
-
50
-
51
-
52
-
53
-
54
-
55
-
56
-
57
-
58
-
59
-
60
-
61
-
62
-
63
-
64
-
65
-
66
-
67
-
 68
68 -
 69
69 -
 70
70 -
 71
71 -
 72
72 -
 73
73 -
 74
74 -
 75
75 -
 76
76 -
 77
77 -
 78
78 -
 79
79 -
 80
80 -
 81
81 -
 82
82 -
 83
83 -
 84
84 -
 85
85 -
 86
86 -
 87
87 -
 88
88 -
89
-
90
-
91
-
92
-
93
-
94
-
95
-
96
-
97
-
98
-
99
-
100
-
101
-
102
-
103
-
104
-
105
-
106
-
107
-
108
-
109
-
110
-
111
-
112
-
113
-
114
-
115
-
116
-
117
-
118
-
119
-
120
-
121
-
122
-
123
-
124
-
125
-
126
-
127
-
128
-
129
-
130
-
131
-
132
-
133
-
134
-
135
-
136
-
137
-
138
-
139
-
140
-
141
-
142
-
143
-
144
-
145
-
146
-
147
-
148
-
149
-
150
-
151
-
152
-
153
-
154
-
155
-
156
-
157
-
158
-
159
-
160
-
161
-
162
-
163
-
164
-
165
-
166
-
167
-
168
-
169
-
170
-
171
-
172
-
173
-
174
-
175
-
176
-
177
-
178
-
179
-
180
-
181
-
182
-
183
-
184
-
185
-
186
-
187
-
188
-
189
-
190
-
191
-
192
-
193
-
194
-
195
-
196
-
197
-
198
-
199
-
200
-
201
-
202
-
203
-
204
-
205
-
206
-
207
-
208
-
209
-
210
-
211
 |
 |
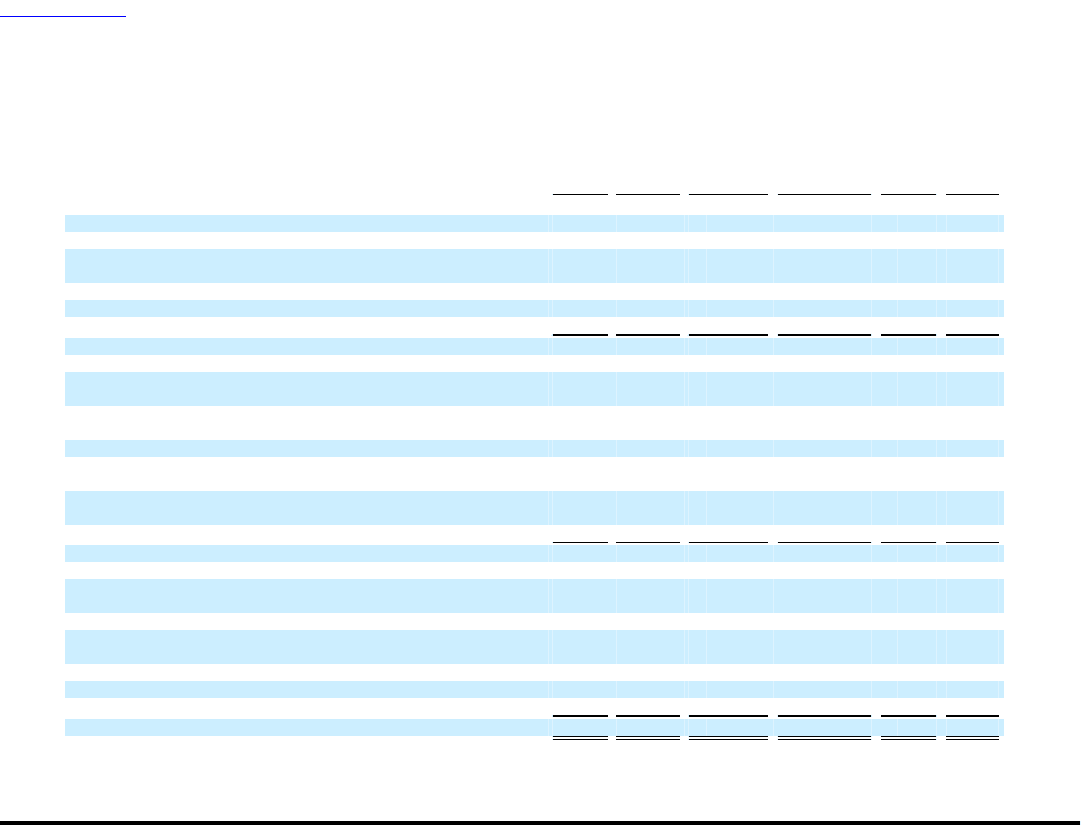
Table of Contents
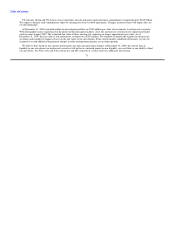
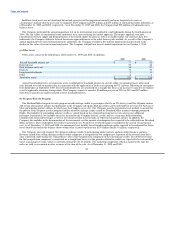
US Airways Group, Inc.
Consolidated Statements of Stockholders' Equity (Deficit)
For the Years Ended December 31, 2009, 2008 and 2007
Accumulated
Additional Other
Common Paid-In Accumulated Comprehensive Treasury
Stock Capital Deficit Income Stock Total
(In millions, except share amounts)
Balance at December 31, 2006 $ 1 $ 1,541 $ (542) $ 3 $ (13) $ 990
Net income — — 423 — — 423
Issuance of 580,661 shares of common stock pursuant to employee
stock plans — 3 — — — 3
Stock-based compensation expense — 32 — — — 32
Unrealized loss on available-for-sale securities, net — — — (48) — (48)
Pension and other postretirement benefits — — — 55 — 55
Balance at December 31, 2007 1 1,576 (119) 10 (13) 1,455
Net loss — — (2,215) — — (2,215)
Issuance of 21,850,000 shares of common stock pursuant to a public
stock offering, net of offering costs — 179 — — — 179
Issuance of 398,820 shares of common stock pursuant to employee
stock plans — — — — — —
Stock-based compensation expense — 34 — — — 34
Recognition of previous unrealized loss on available-for-sale
securities, net now deemed other-than-temporary — — — 48 — 48
Effect of adopting the measurement date provisions of employers'
accounting for other postretirement benefit plans — — (2) — — (2)
Pension and other postretirement benefits — — — 7 — 7
Balance at December 31, 2008 1 1,789 (2,336) 65 (13) (494)
Net loss — — (205) — — (205)
Issuance of 46,495,790 shares of common stock pursuant to public
stock offerings, net of offering costs 1 202 — — — 203
Equity component of convertible debt issued — 96 — — — 96
Issuance of 497,290 shares of common stock and acquisition of
3,631 shares of treasury stock pursuant to employee stock plans — — — — — —
Stock-based compensation expense — 20 — — — 20
Net unrealized gain on available-for-sale securities, net of tax — — — 35 — 35
Pension and other postretirement benefits — — — (10) — (10)
Balance at December 31, 2009 $ 2 $ 2,107 $ (2,541) $ 90 $ (13) $ (355)
See accompanying notes to consolidated financial statements.
76