Travelers 2010 Annual Report Download - page 99
Download and view the complete annual report
Please find page 99 of the 2010 Travelers annual report below. You can navigate through the pages in the report by either clicking on the pages listed below, or by using the keyword search tool below to find specific information within the annual report.-
 1
1 -
2
-
3
-
4
-
5
-
6
-
7
-
8
-
9
-
10
-
11
-
12
-
13
-
14
-
15
-
16
-
17
-
18
-
19
-
20
-
21
-
22
-
23
-
24
-
25
-
26
-
27
-
28
-
29
-
30
-
31
-
32
-
33
-
34
-
35
-
36
-
37
-
38
-
39
-
40
-
41
-
42
-
43
-
44
-
45
-
46
-
47
-
48
-
49
-
50
-
51
-
52
-
53
-
54
-
55
-
56
-
57
-
58
-
59
-
60
-
61
-
62
-
63
-
64
-
65
-
66
-
67
-
68
-
69
-
70
-
71
-
72
-
73
-
74
-
75
-
76
-
77
-
78
-
79
-
80
-
81
-
82
-
83
-
84
-
85
-
86
-
87
-
88
-
 89
89 -
 90
90 -
 91
91 -
 92
92 -
 93
93 -
 94
94 -
 95
95 -
 96
96 -
 97
97 -
 98
98 -
 99
99 -
 100
100 -
 101
101 -
 102
102 -
 103
103 -
 104
104 -
 105
105 -
 106
106 -
 107
107 -
 108
108 -
 109
109 -
110
-
111
-
112
-
113
-
114
-
115
-
116
-
117
-
118
-
119
-
120
-
121
-
122
-
123
-
124
-
125
-
126
-
127
-
128
-
129
-
130
-
131
-
132
-
133
-
134
-
135
-
136
-
137
-
138
-
139
-
140
-
141
-
142
-
143
-
144
-
145
-
146
-
147
-
148
-
149
-
150
-
151
-
152
-
153
-
154
-
155
-
156
-
157
-
158
-
159
-
160
-
161
-
162
-
163
-
164
-
165
-
166
-
167
-
168
-
169
-
170
-
171
-
172
-
173
-
174
-
175
-
176
-
177
-
178
-
179
-
180
-
181
-
182
-
183
-
184
-
185
-
186
-
187
-
188
-
189
-
190
-
191
-
192
-
193
-
194
-
195
-
196
-
197
-
198
-
199
-
200
-
201
-
202
-
203
-
204
-
205
-
206
-
207
-
208
-
209
-
210
-
211
-
212
-
213
-
214
-
215
-
216
-
217
-
218
-
219
-
220
-
221
-
222
-
223
-
224
-
225
-
226
-
227
-
228
-
229
-
230
-
231
-
232
-
233
-
234
-
235
-
236
-
237
-
238
-
239
-
240
-
241
-
242
-
243
-
244
-
245
-
246
-
247
-
248
-
249
-
250
-
251
-
252
-
253
-
254
-
255
-
256
-
257
-
258
-
259
-
260
-
261
-
262
-
263
-
264
-
265
-
266
-
267
-
268
-
269
-
270
-
271
-
272
-
273
-
274
-
275
-
276
-
277
-
278
-
279
-
280
-
281
-
282
-
283
-
284
-
285
-
286
-
287
-
288
-
289
-
290
-
291
-
292
 |
 |

In 2009 in Bond & Financial Products, business retention rates remained strong but decreased
from 2008, primarily in professional liability. Renewal premium changes in 2009 increased slightly over
2008, as the impact of slight positive renewal rate changes on written premiums was largely offset by
reduced insured exposures due to underwriting actions and lower levels of economic activity. New
business levels in 2009 were lower than in 2008. In International, business retention rates in 2009
declined from 2008, primarily due to underwriting actions taken in the United Kingdom, Ireland and at
the Company’s operations at Lloyd’s. Renewal premium changes improved over 2008 and new business
levels declined when compared with 2008.
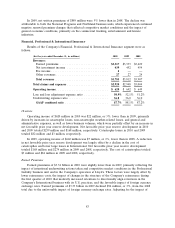
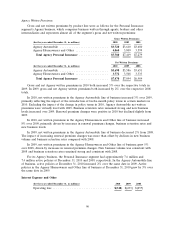
Personal Insurance
Results of the Company’s Personal Insurance segment were as follows:
(for the year ended December 31, in millions) 2010 2009 2008
Revenues:
Earned premiums ............................ $7,349 $7,117 $6,970
Net investment income ........................ 464 422 421
Other revenues .............................. 75 84 75
Total revenues ............................... $7,888 $7,623 $7,466
Total claims and expenses ........................ $7,314 $6,824 $6,885
Operating income .............................. $ 440 $ 601 $ 465
Loss and loss adjustment expense ratio .............. 68.1% 65.0% 66.2%
Underwriting expense ratio ....................... 30.2 29.6 30.8
GAAP combined ratio ......................... 98.3% 94.6% 97.0%
Incremental impact of direct to consumer initiative on
GAAP combined ratio ....................... 2.2% 1.7% 0.5%
Overview
In 2010, operating income of $440 million was $161 million, or 27%, lower than in 2009. The
decline primarily reflected the significant increase in catastrophe losses, a decline in net favorable prior
year reserve development and an increase in expenses related to the Company’s direct to consumer
initiative. These factors were partially offset by increases in net investment income and business
volume, the favorable impact of earned rate increases outpacing loss cost trends and a reduction in
non-catastrophe weather-related losses. In addition, operating income in 2009 included a $48 million
reduction in the estimate of property windpool assessments related to Hurricane Ike that had been
recorded in general and administrative expenses in 2008. Catastrophe losses in 2010 and 2009 totaled
$594 million and $278 million, respectively. Net favorable prior year reserve development in 2010 and
2009 totaled $87 million and $135 million, respectively.
In 2009, operating income of $601 million was $136 million, or 29%, higher than in 2008, driven by
the significant decline in catastrophe losses and a reduction in the estimate of property windpool
assessments, partially offset by investments in the direct to consumer initiative and loss cost trends.
Catastrophe losses in 2009 and 2008 totaled $278 million and $618 million, respectively. The 2008 total
was comprised of $541 million of claims and claim adjustment expenses and $77 million of property
windpool assessments that were included in general and administrative expenses. Net favorable prior
year reserve development in 2009 and 2008 totaled $135 million and $143 million, respectively.
87