Travelers 2010 Annual Report Download - page 88
Download and view the complete annual report
Please find page 88 of the 2010 Travelers annual report below. You can navigate through the pages in the report by either clicking on the pages listed below, or by using the keyword search tool below to find specific information within the annual report.-
 1
1 -
2
-
3
-
4
-
5
-
6
-
7
-
8
-
9
-
10
-
11
-
12
-
13
-
14
-
15
-
16
-
17
-
18
-
19
-
20
-
21
-
22
-
23
-
24
-
25
-
26
-
27
-
28
-
29
-
30
-
31
-
32
-
33
-
34
-
35
-
36
-
37
-
38
-
39
-
40
-
41
-
42
-
43
-
44
-
45
-
46
-
47
-
48
-
49
-
50
-
51
-
52
-
53
-
54
-
55
-
56
-
57
-
58
-
59
-
60
-
61
-
62
-
63
-
64
-
65
-
66
-
67
-
68
-
69
-
70
-
71
-
72
-
73
-
74
-
75
-
76
-
77
-
 78
78 -
 79
79 -
 80
80 -
 81
81 -
 82
82 -
 83
83 -
 84
84 -
 85
85 -
 86
86 -
 87
87 -
 88
88 -
 89
89 -
 90
90 -
 91
91 -
 92
92 -
 93
93 -
 94
94 -
 95
95 -
 96
96 -
 97
97 -
 98
98 -
99
-
100
-
101
-
102
-
103
-
104
-
105
-
106
-
107
-
108
-
109
-
110
-
111
-
112
-
113
-
114
-
115
-
116
-
117
-
118
-
119
-
120
-
121
-
122
-
123
-
124
-
125
-
126
-
127
-
128
-
129
-
130
-
131
-
132
-
133
-
134
-
135
-
136
-
137
-
138
-
139
-
140
-
141
-
142
-
143
-
144
-
145
-
146
-
147
-
148
-
149
-
150
-
151
-
152
-
153
-
154
-
155
-
156
-
157
-
158
-
159
-
160
-
161
-
162
-
163
-
164
-
165
-
166
-
167
-
168
-
169
-
170
-
171
-
172
-
173
-
174
-
175
-
176
-
177
-
178
-
179
-
180
-
181
-
182
-
183
-
184
-
185
-
186
-
187
-
188
-
189
-
190
-
191
-
192
-
193
-
194
-
195
-
196
-
197
-
198
-
199
-
200
-
201
-
202
-
203
-
204
-
205
-
206
-
207
-
208
-
209
-
210
-
211
-
212
-
213
-
214
-
215
-
216
-
217
-
218
-
219
-
220
-
221
-
222
-
223
-
224
-
225
-
226
-
227
-
228
-
229
-
230
-
231
-
232
-
233
-
234
-
235
-
236
-
237
-
238
-
239
-
240
-
241
-
242
-
243
-
244
-
245
-
246
-
247
-
248
-
249
-
250
-
251
-
252
-
253
-
254
-
255
-
256
-
257
-
258
-
259
-
260
-
261
-
262
-
263
-
264
-
265
-
266
-
267
-
268
-
269
-
270
-
271
-
272
-
273
-
274
-
275
-
276
-
277
-
278
-
279
-
280
-
281
-
282
-
283
-
284
-
285
-
286
-
287
-
288
-
289
-
290
-
291
-
292
 |
 |

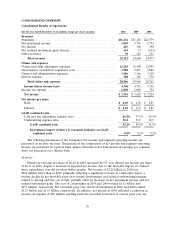
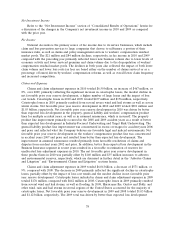
The consolidated GAAP combined ratio of 89.2% in 2009 was 2.7 points lower than the
consolidated GAAP combined ratio of 91.9% in 2008.
The consolidated loss and loss adjustment expense ratio of 57.3% in 2009 was 2.1 points lower
than the loss and loss adjustment expense ratio of 59.4% in 2008. Catastrophe losses accounted for 2.1
points and 5.8 points of the 2009 and 2008 loss and loss adjustment expense ratios, respectively. The
2009 and 2008 loss and loss adjustment expense ratios included 6.2 point and 7.1 point benefits from
net favorable prior year reserve development, respectively. The consolidated loss and loss adjustment
expense ratio adjusted for catastrophe losses and prior year reserve development in 2009 was 0.7 points
higher than the 2008 ratio on the same basis, primarily reflecting the impact of loss cost trends in the
Business Insurance and Personal Insurance segments, partially offset by lower non-catastrophe weather-
related losses across the Company’s segments, and fewer large property losses in the Financial,
Professional & International Insurance segment.
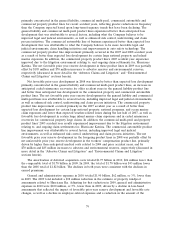
In 2009, the consolidated underwriting expense ratio of 31.9% was 0.6 points lower than the
consolidated underwriting expense ratio of 32.5% in 2008. The underwriting expense ratio in 2009
included a 0.4 point benefit from the reduction in the estimate of windpool assessments described
above, whereas the underwriting expense ratio in 2008 included a 0.7 point increase due to the impact
of the windpool assessments. Adjusting for these factors in both years, the underwriting expense ratio
for 2009 was 0.5 points higher than the respective 2008 underwriting expense ratio, primarily reflecting
the impact of continued investments to support business growth and product development, including
the Company’s direct to consumer initiative in the Personal Insurance segment, as well as salary
increases in the normal course of business.
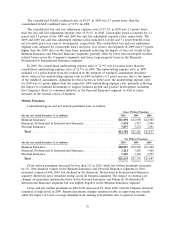
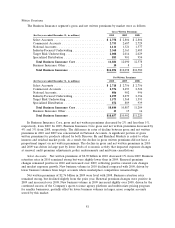
Written Premiums
Consolidated gross and net written premiums were as follows:
Gross Written Premiums
(for the year ended December 31, in millions) 2010 2009 2008
Business Insurance ........................................ $11,891 $12,098 $12,580
Financial, Professional & International Insurance .................. 3,534 3,713 3,966
Personal Insurance ........................................ 7,877 7,474 7,291
Total ................................................ $23,302 $23,285 $23,837
Net Written Premiums
(for the year ended December 31, in millions) 2010 2009 2008
Business Insurance ........................................ $10,857 $10,902 $11,220
Financial, Professional & International Insurance .................. 3,211 3,285 3,468
Personal Insurance ........................................ 7,567 7,149 6,995
Total ................................................ $21,635 $21,336 $21,683
Gross written premiums increased by less than 1% in 2010, while net written premiums increased
by 1%. New business volume in the Business Insurance and Personal Insurance segments in 2010
increased compared with 2009, but declined in the Financial, Professional & International Insurance
segment. Retention rates remained strong across all business segments. The impact of renewal rate
changes on premiums remained positive in the Personal Insurance and Financial, Professional &
International Insurance segments but was slightly negative in the Business Insurance segment.
Gross and net written premiums in 2009 both decreased 2% from 2008. Overall, business retention
remained at high levels in 2009. Renewal premium changes remained stable as improving rate trends
offset the impact of lower coverage demands from existing policyholders due to general economic
76