Travelers 2010 Annual Report Download - page 291
Download and view the complete annual report
Please find page 291 of the 2010 Travelers annual report below. You can navigate through the pages in the report by either clicking on the pages listed below, or by using the keyword search tool below to find specific information within the annual report.-
 1
1 -
2
-
3
-
4
-
5
-
6
-
7
-
8
-
9
-
10
-
11
-
12
-
13
-
14
-
15
-
16
-
17
-
18
-
19
-
20
-
21
-
22
-
23
-
24
-
25
-
26
-
27
-
28
-
29
-
30
-
31
-
32
-
33
-
34
-
35
-
36
-
37
-
38
-
39
-
40
-
41
-
42
-
43
-
44
-
45
-
46
-
47
-
48
-
49
-
50
-
51
-
52
-
53
-
54
-
55
-
56
-
57
-
58
-
59
-
60
-
61
-
62
-
63
-
64
-
65
-
66
-
67
-
68
-
69
-
70
-
71
-
72
-
73
-
74
-
75
-
76
-
77
-
78
-
79
-
80
-
81
-
82
-
83
-
84
-
85
-
86
-
87
-
88
-
89
-
90
-
91
-
92
-
93
-
94
-
95
-
96
-
97
-
98
-
99
-
100
-
101
-
102
-
103
-
104
-
105
-
106
-
107
-
108
-
109
-
110
-
111
-
112
-
113
-
114
-
115
-
116
-
117
-
118
-
119
-
120
-
121
-
122
-
123
-
124
-
125
-
126
-
127
-
128
-
129
-
130
-
131
-
132
-
133
-
134
-
135
-
136
-
137
-
138
-
139
-
140
-
141
-
142
-
143
-
144
-
145
-
146
-
147
-
148
-
149
-
150
-
151
-
152
-
153
-
154
-
155
-
156
-
157
-
158
-
159
-
160
-
161
-
162
-
163
-
164
-
165
-
166
-
167
-
168
-
169
-
170
-
171
-
172
-
173
-
174
-
175
-
176
-
177
-
178
-
179
-
180
-
181
-
182
-
183
-
184
-
185
-
186
-
187
-
188
-
189
-
190
-
191
-
192
-
193
-
194
-
195
-
196
-
197
-
198
-
199
-
200
-
201
-
202
-
203
-
204
-
205
-
206
-
207
-
208
-
209
-
210
-
211
-
212
-
213
-
214
-
215
-
216
-
217
-
218
-
219
-
220
-
221
-
222
-
223
-
224
-
225
-
226
-
227
-
228
-
229
-
230
-
231
-
232
-
233
-
234
-
235
-
236
-
237
-
238
-
239
-
240
-
241
-
242
-
243
-
244
-
245
-
246
-
247
-
248
-
249
-
250
-
251
-
252
-
253
-
254
-
255
-
256
-
257
-
258
-
259
-
260
-
261
-
262
-
263
-
264
-
265
-
266
-
267
-
268
-
269
-
270
-
271
-
272
-
273
-
274
-
275
-
276
-
277
-
278
-
279
-
280
-
 281
281 -
 282
282 -
 283
283 -
 284
284 -
 285
285 -
 286
286 -
 287
287 -
 288
288 -
 289
289 -
 290
290 -
 291
291 -
 292
292
 |
 |

Return on equity is the ratio of net income (loss) less preferred
dividends to average shareholders’ equity for the periods presented.
Operating return on equity is the ratio of operating income (loss)
less preferred dividends to adjusted average shareholders’ equity
for the periods presented. Adjusted average shareholders’ equity is
average shareholders’ equity excluding net unrealized investment
gains (losses), net of tax, and that period’s net realized investment
gains (losses), net of tax.
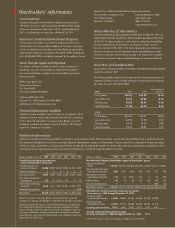
Shareholders’ information
Your Dividends
Travelers has paid cash dividends without interruption for
139 years. Our most recent quarterly dividend of $0.36 per
share was declared on February 2, 2011, payable March 31,
2011, to shareholders of record as of March 10, 2011.
Automatic Dividend Reinvestment Program
This program provides a convenient opportunity for our
shareholders to increase their holding of Travelers common
stock. An explanatory brochure and enrollment card may be
obtained by calling our stock transfer agent, Wells Fargo Bank,
N.A. at 888.326.5102, or mailing a request to the address below.
Stock Transfer Agent and Registrar
For address changes, dividend checks, direct deposits of
dividends, account consolidations, registration changes,
lost stock certifi cates and general stock holding questions,
please contact:
Wells Fargo Bank, N.A.
Shareowner Services
P.O. Box 64854
Saint Paul, MN 55164-0854
Toll Free: 888.326.5102
Outside U.S. and Canada: 651.450.4064
wellsfargo.com/shareownerservices
Financial Information Available
Travelers makes available, free of charge on its website, all of
its fi lings that are made electronically with the SEC, including
Forms 10-K, 10-Q and 8-K. To access these fi lings, go to the
company’s website (travelers.com) and click on “SEC Filings”
under the “Investors” heading.
Requests for additional information may be directed to:
The Travelers Companies, Inc. Investor Relations, 2MS
One Tower Square Attn: Marc Parr
Hartford, CT 06183 860.277.0779
mparr@travelers.com
Annual Meeting of Shareholders
The Annual Meeting of Shareholders will be held on May 26, 2011, at
the Hartford Marriott Downtown, 200 Columbus Boulevard, Hartford,
CT 06103. In April, we plan to send a Notice of Internet Availability
of Proxy Materials to shareholders of record as of the close of
business on March 28, 2011. The notice provides instructions on
where to access our Proxy Statement and Annual Report as well
as how to vote your shares electronically. The notice also includes
instructions on how to request a printed copy of our proxy materials.
Stock Price and Dividend Rate
Our common stock is traded on The New York Stock Exchange (NYSE)
under the symbol “TRV”.
The following tables set forth the high and low closing sales prices of
Travelers common stock and the amount of cash dividends declared
per share for years 2010 and 2009.
2010 High Low
Cash Dividend
Declared
First Quarter $54.76 $47.94 $0.33
Second Quarter 53.92 48.00 0.36
Third Quarter 53.56 48.54 0.36
Fourth Quarter 57.44 52.12 0.36
2009
First Quarter $45.20 $33.52 $0.30
Second Quarter 44.04 37.48 0.30
Third Quarter 50.42 39.00 0.30
Fourth Quarter 54.31 48.02 0.33
Additional Information
We have included the following tables to provide a reconciliation of the following items used in this Annual Report: (i) operating income
less preferred dividends to net income and (ii) adjusted shareholders’ equity to shareholders’ equity, which are components of the operating
return on equity and return on equity ratios for the six-year period ending December 31, 2010. Also, we have included the components of the
calculation of average operating return on equity from January 1, 2005 through December 31, 2010.
Twelve months ended December 31,
(Dollars in millions; after-tax) 2010 2009 2008 2007 2006 2005
Reconciliation of operating income less
preferred dividends to net income
Operating income, less
preferred dividends $3,040 $3,597 $3,191 $4,496 $4,195 $2,020
Preferred dividends 334456
Operating income 3,043 3,600 3,195 4,500 4,200 2,026
Net realized investment
gains (losses) 173 22 (271) 101 8 35
Income from continuing
operations 3,216 3,622 2,924 4,601 4,208 2,061
Discontinued operations –––––(439)
Net income $3,216 $3,622 $2,924 $4,601 $4,208 $1,622
As of December 31,
(Dollars in millions) 2010 2009 2008 2007 2006 2005 2004
Reconciliation of adjusted shareholders’ equity to shareholders’ equity
Adjusted shareholders’
equity $23,376 $25,453 $25,645 $25,783 $24,545 $22,227 $20,087
Net unrealized investment
gains (losses), net of tax 1,858 1,861 (144) 620 453 327 866
Net realized investment
gains (losses), net of tax 173 22 (271) 101 8 35 (28)
Preferred stock 68 79 89 112 129 153 188
Discontinued operations –– – – – (439) 88
Shareholders’ equity $25,475 $27,415 $25,319 $26,616 $25,135 $22,303 $21,201
Calculation of average annual operating return on equity
from January 1, 2005 through December 31, 2010
Operating income,
less preferred dividends $3,040 $3,597 $3,191 $4,496 $4,195 $2,020
Adjusted average
shareholders’ equity 24,287 25,774 25,668 25,350 23,381 21,118
Operating return on equity 12.5% 14.0% 12.4% 17.7% 17.9% 9.6%
Average annual operating return on equity
for the period January 1, 2005 through December 31, 2010 14.1%
© 2011 The Travelers Indemnity Company. All rights reserved. 59781