Travelers 2010 Annual Report Download - page 87
Download and view the complete annual report
Please find page 87 of the 2010 Travelers annual report below. You can navigate through the pages in the report by either clicking on the pages listed below, or by using the keyword search tool below to find specific information within the annual report.-
 1
1 -
2
-
3
-
4
-
5
-
6
-
7
-
8
-
9
-
10
-
11
-
12
-
13
-
14
-
15
-
16
-
17
-
18
-
19
-
20
-
21
-
22
-
23
-
24
-
25
-
26
-
27
-
28
-
29
-
30
-
31
-
32
-
33
-
34
-
35
-
36
-
37
-
38
-
39
-
40
-
41
-
42
-
43
-
44
-
45
-
46
-
47
-
48
-
49
-
50
-
51
-
52
-
53
-
54
-
55
-
56
-
57
-
58
-
59
-
60
-
61
-
62
-
63
-
64
-
65
-
66
-
67
-
68
-
69
-
70
-
71
-
72
-
73
-
74
-
75
-
76
-
 77
77 -
 78
78 -
 79
79 -
 80
80 -
 81
81 -
 82
82 -
 83
83 -
 84
84 -
 85
85 -
 86
86 -
 87
87 -
 88
88 -
 89
89 -
 90
90 -
 91
91 -
 92
92 -
 93
93 -
 94
94 -
 95
95 -
 96
96 -
 97
97 -
98
-
99
-
100
-
101
-
102
-
103
-
104
-
105
-
106
-
107
-
108
-
109
-
110
-
111
-
112
-
113
-
114
-
115
-
116
-
117
-
118
-
119
-
120
-
121
-
122
-
123
-
124
-
125
-
126
-
127
-
128
-
129
-
130
-
131
-
132
-
133
-
134
-
135
-
136
-
137
-
138
-
139
-
140
-
141
-
142
-
143
-
144
-
145
-
146
-
147
-
148
-
149
-
150
-
151
-
152
-
153
-
154
-
155
-
156
-
157
-
158
-
159
-
160
-
161
-
162
-
163
-
164
-
165
-
166
-
167
-
168
-
169
-
170
-
171
-
172
-
173
-
174
-
175
-
176
-
177
-
178
-
179
-
180
-
181
-
182
-
183
-
184
-
185
-
186
-
187
-
188
-
189
-
190
-
191
-
192
-
193
-
194
-
195
-
196
-
197
-
198
-
199
-
200
-
201
-
202
-
203
-
204
-
205
-
206
-
207
-
208
-
209
-
210
-
211
-
212
-
213
-
214
-
215
-
216
-
217
-
218
-
219
-
220
-
221
-
222
-
223
-
224
-
225
-
226
-
227
-
228
-
229
-
230
-
231
-
232
-
233
-
234
-
235
-
236
-
237
-
238
-
239
-
240
-
241
-
242
-
243
-
244
-
245
-
246
-
247
-
248
-
249
-
250
-
251
-
252
-
253
-
254
-
255
-
256
-
257
-
258
-
259
-
260
-
261
-
262
-
263
-
264
-
265
-
266
-
267
-
268
-
269
-
270
-
271
-
272
-
273
-
274
-
275
-
276
-
277
-
278
-
279
-
280
-
281
-
282
-
283
-
284
-
285
-
286
-
287
-
288
-
289
-
290
-
291
-
292
 |
 |
hurricane-related assessments in general and administrative expenses. The Company subsequently
recorded an $87 million reduction in these estimated assessments in 2009 due to a decline in estimated
insurance industry losses related to Hurricane Ike. Adjusting for the impact of windpool assessments in
both 2009 and 2008, general and administrative expenses in 2009 increased 2% over 2008. The increase
reflected the impact of continued investments to support business growth and product development,
including the Company’s direct to consumer initiative in the Personal Insurance segment, partially
offset by the favorable impact of changes in foreign currency exchange rates on expenses in the
Financial, Professional & International Insurance segment.
Hurricane-related property windpool assessments are levied on insurers periodically by state-
created insurance and windstorm insurance entities such as Citizens Property Insurance Corporation in
Florida, Louisiana Citizens Property Insurance Corporation and the Texas Windstorm Insurance
Association. These assessments are levied on the insurers writing business in those states to fund the
operating deficits of such entities during periods of significant storm activity. Hurricane-related
assessments are reported as a component of ‘‘General and Administrative Expenses’’ as the amounts
paid to such entities are not insured losses of the Company.
Interest Expense
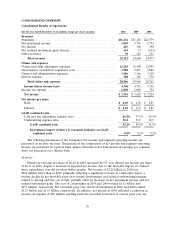
Interest expense in 2010, 2009 and 2008 totaled $388 million, $382 million and $370 million,
respectively. The increases in 2010 and 2009 over the respective prior year primarily reflected higher
average levels of debt outstanding.
Effective Tax Rate
The Company’s effective tax rate was 25%, 23% and 21% in 2010, 2009 and 2008, respectively.
The effective tax rate in 2009 benefited from the favorable resolution of prior year tax matters.
Excluding that benefit in 2009, the effective tax rates in 2010 and 2009 were virtually level. The
increase in the effective rate in 2009 compared to 2008 primarily resulted from the change in income
before taxes between years and the proportion of tax-exempt investment income in each year.
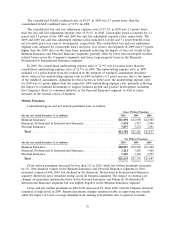
GAAP Combined Ratios
The consolidated GAAP combined ratio of 93.2% in 2010 was 4.0 points higher than the
consolidated GAAP combined ratio of 89.2% in 2009.
The consolidated loss and loss adjustment expense ratio of 61.0% in 2010 was 3.7 points higher
than the loss and loss adjustment expense ratio of 57.3% in 2009. Catastrophe losses accounted for 5.2
points and 2.1 points of the 2010 and 2009 loss and loss adjustment expense ratios, respectively. The
2010 and 2009 consolidated loss and loss adjustment expense ratios included 5.8 point and 6.2 point
benefits from net favorable prior year reserve development, respectively. The consolidated loss and loss
adjustment expense ratios excluding catastrophe losses and prior year reserve development in 2010 was
0.2 points higher than the 2009 ratio on the same basis, primarily reflecting the impact of reduced
underwriting margins related to pricing and loss cost trends in the Business Insurance segment, largely
offset by earned rate increases modestly outpacing loss cost trends in the Personal Insurance segment.
The consolidated underwriting expense ratio of 32.2% in 2010 was 0.3 points higher than the 2009
consolidated underwriting expense ratio of 31.9%. The 2009 ratio reflected a 0.4 point benefit resulting
from the reduction in the estimate of property windpool assessments related to Hurricane Ike.
Excluding that factor in 2009, the consolidated underwriting expense ratio in 2010 was 0.1 points lower
than in 2009, primarily reflecting lower expenses in the Business Insurance segment, largely offset by
higher expenses in the Personal Insurance segment resulting from the Company’s direct to consumer
initiative and in the Financial, Professional & International Insurance segment due to employee- and
technology-related costs to enhance operations and support future business growth.
75