Travelers 2010 Annual Report Download - page 14
Download and view the complete annual report
Please find page 14 of the 2010 Travelers annual report below. You can navigate through the pages in the report by either clicking on the pages listed below, or by using the keyword search tool below to find specific information within the annual report.-
 1
1 -
2
-
3
-
 4
4 -
 5
5 -
 6
6 -
 7
7 -
 8
8 -
 9
9 -
 10
10 -
 11
11 -
 12
12 -
 13
13 -
 14
14 -
 15
15 -
 16
16 -
 17
17 -
 18
18 -
 19
19 -
 20
20 -
 21
21 -
 22
22 -
 23
23 -
 24
24 -
25
-
26
-
27
-
28
-
29
-
30
-
31
-
32
-
33
-
34
-
35
-
36
-
37
-
38
-
39
-
40
-
41
-
42
-
43
-
44
-
45
-
46
-
47
-
48
-
49
-
50
-
51
-
52
-
53
-
54
-
55
-
56
-
57
-
58
-
59
-
60
-
61
-
62
-
63
-
64
-
65
-
66
-
67
-
68
-
69
-
70
-
71
-
72
-
73
-
74
-
75
-
76
-
77
-
78
-
79
-
80
-
81
-
82
-
83
-
84
-
85
-
86
-
87
-
88
-
89
-
90
-
91
-
92
-
93
-
94
-
95
-
96
-
97
-
98
-
99
-
100
-
101
-
102
-
103
-
104
-
105
-
106
-
107
-
108
-
109
-
110
-
111
-
112
-
113
-
114
-
115
-
116
-
117
-
118
-
119
-
120
-
121
-
122
-
123
-
124
-
125
-
126
-
127
-
128
-
129
-
130
-
131
-
132
-
133
-
134
-
135
-
136
-
137
-
138
-
139
-
140
-
141
-
142
-
143
-
144
-
145
-
146
-
147
-
148
-
149
-
150
-
151
-
152
-
153
-
154
-
155
-
156
-
157
-
158
-
159
-
160
-
161
-
162
-
163
-
164
-
165
-
166
-
167
-
168
-
169
-
170
-
171
-
172
-
173
-
174
-
175
-
176
-
177
-
178
-
179
-
180
-
181
-
182
-
183
-
184
-
185
-
186
-
187
-
188
-
189
-
190
-
191
-
192
-
193
-
194
-
195
-
196
-
197
-
198
-
199
-
200
-
201
-
202
-
203
-
204
-
205
-
206
-
207
-
208
-
209
-
210
-
211
-
212
-
213
-
214
-
215
-
216
-
217
-
218
-
219
-
220
-
221
-
222
-
223
-
224
-
225
-
226
-
227
-
228
-
229
-
230
-
231
-
232
-
233
-
234
-
235
-
236
-
237
-
238
-
239
-
240
-
241
-
242
-
243
-
244
-
245
-
246
-
247
-
248
-
249
-
250
-
251
-
252
-
253
-
254
-
255
-
256
-
257
-
258
-
259
-
260
-
261
-
262
-
263
-
264
-
265
-
266
-
267
-
268
-
269
-
270
-
271
-
272
-
273
-
274
-
275
-
276
-
277
-
278
-
279
-
280
-
281
-
282
-
283
-
284
-
285
-
286
-
287
-
288
-
289
-
290
-
291
-
292
 |
 |

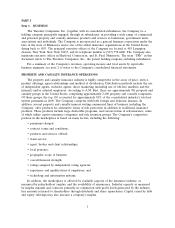
Pricing and Underwriting
Pricing of the Company’s property and casualty insurance products is generally developed based
upon an estimation of expected losses, the expenses of producing, issuing and servicing business and
managing claims, the time value of money associated with such loss and expense cash flows, and a
reasonable allowance for profit. The Company has a disciplined approach to underwriting and risk
management that emphasizes profitable growth rather than premium volume or market share. The
Company’s insurance subsidiaries are subject to each state’s laws and regulations regarding rate and
policy form approvals. The applicable state laws and regulations establish standards in certain lines of
business to ensure that rates are not excessive, inadequate, unfairly discriminatory, or used to engage in
unfair price competition. The Company’s ability to increase rates and the relative timing of the process
are dependent upon each respective state’s requirements, as well as the competitive market
environment.
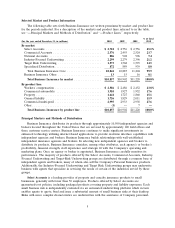
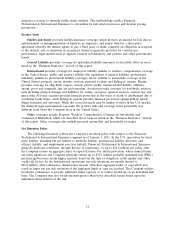
Geographic Distribution
The following table shows the geographic distribution of the Company’s consolidated direct written
premiums for the year ended December 31, 2010:
% of
State Total
California .................................................. 9.7%
New York ................................................. 9.7
Texas ..................................................... 7.3
Pennsylvania ................................................ 5.1
Florida ................................................... 4.3
New Jersey ................................................ 3.9
Illinois .................................................... 3.8
Massachusetts .............................................. 3.6
Georgia ................................................... 3.2
All other domestic(1) ......................................... 43.8
Total domestic ............................................. 94.4
International ............................................... 5.6
Consolidated total .......................................... 100.0%
(1) No other single state accounted for 3.0% or more of the total direct written premiums
written in 2010 by the Company’s domestic operations.
Catastrophe Exposure
The wide geographic distribution of the Company’s property and casualty insurance operations
exposes it to claims arising out of catastrophes. The Company uses various analyses and methods,
including sophisticated computer modeling techniques, to continually monitor and analyze underwriting
risks of business in natural catastrophe-prone areas and target risk areas for conventional terrorism,
which excludes nuclear, biological, chemical or radiological events. The Company relies, in part, upon
this analysis to make underwriting decisions designed to manage its exposure on catastrophe-exposed
business. The Company limits the writing of new property and homeowners business, and each of the
Company’s reportable business segments have selectively taken underwriting action on existing business
in some markets. In addition, in recent years, each segment has also tightened underwriting standards,
implemented price increases in some catastrophe-prone areas and put in place deductibles specific to
hurricane-, wind- and hail-prone areas. See ‘‘Item 7—Management’s Discussion and Analysis of
2