Travelers 2010 Annual Report Download - page 80
Download and view the complete annual report
Please find page 80 of the 2010 Travelers annual report below. You can navigate through the pages in the report by either clicking on the pages listed below, or by using the keyword search tool below to find specific information within the annual report.-
 1
1 -
2
-
3
-
4
-
5
-
6
-
7
-
8
-
9
-
10
-
11
-
12
-
13
-
14
-
15
-
16
-
17
-
18
-
19
-
20
-
21
-
22
-
23
-
24
-
25
-
26
-
27
-
28
-
29
-
30
-
31
-
32
-
33
-
34
-
35
-
36
-
37
-
38
-
39
-
40
-
41
-
42
-
43
-
44
-
45
-
46
-
47
-
48
-
49
-
50
-
51
-
52
-
53
-
54
-
55
-
56
-
57
-
58
-
59
-
60
-
61
-
62
-
63
-
64
-
65
-
66
-
67
-
68
-
69
-
 70
70 -
 71
71 -
 72
72 -
 73
73 -
 74
74 -
 75
75 -
 76
76 -
 77
77 -
 78
78 -
 79
79 -
 80
80 -
 81
81 -
 82
82 -
 83
83 -
 84
84 -
 85
85 -
 86
86 -
 87
87 -
 88
88 -
 89
89 -
 90
90 -
91
-
92
-
93
-
94
-
95
-
96
-
97
-
98
-
99
-
100
-
101
-
102
-
103
-
104
-
105
-
106
-
107
-
108
-
109
-
110
-
111
-
112
-
113
-
114
-
115
-
116
-
117
-
118
-
119
-
120
-
121
-
122
-
123
-
124
-
125
-
126
-
127
-
128
-
129
-
130
-
131
-
132
-
133
-
134
-
135
-
136
-
137
-
138
-
139
-
140
-
141
-
142
-
143
-
144
-
145
-
146
-
147
-
148
-
149
-
150
-
151
-
152
-
153
-
154
-
155
-
156
-
157
-
158
-
159
-
160
-
161
-
162
-
163
-
164
-
165
-
166
-
167
-
168
-
169
-
170
-
171
-
172
-
173
-
174
-
175
-
176
-
177
-
178
-
179
-
180
-
181
-
182
-
183
-
184
-
185
-
186
-
187
-
188
-
189
-
190
-
191
-
192
-
193
-
194
-
195
-
196
-
197
-
198
-
199
-
200
-
201
-
202
-
203
-
204
-
205
-
206
-
207
-
208
-
209
-
210
-
211
-
212
-
213
-
214
-
215
-
216
-
217
-
218
-
219
-
220
-
221
-
222
-
223
-
224
-
225
-
226
-
227
-
228
-
229
-
230
-
231
-
232
-
233
-
234
-
235
-
236
-
237
-
238
-
239
-
240
-
241
-
242
-
243
-
244
-
245
-
246
-
247
-
248
-
249
-
250
-
251
-
252
-
253
-
254
-
255
-
256
-
257
-
258
-
259
-
260
-
261
-
262
-
263
-
264
-
265
-
266
-
267
-
268
-
269
-
270
-
271
-
272
-
273
-
274
-
275
-
276
-
277
-
278
-
279
-
280
-
281
-
282
-
283
-
284
-
285
-
286
-
287
-
288
-
289
-
290
-
291
-
292
 |
 |

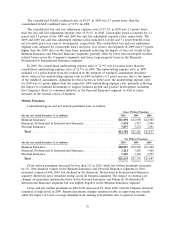
Item 6. SELECTED FINANCIAL DATA
At and for the year ended December 31,
2010 2009 2008 2007 2006
(in millions, except per share amounts)
Total revenues ........................ $ 25,112 $ 24,680 $ 24,477 $ 26,017 $ 25,090
Net income .......................... $ 3,216 $ 3,622 $ 2,924 $ 4,601 $ 4,208
Total investments ...................... $ 72,722 $ 74,965 $ 70,738 $ 74,818 $ 72,268
Total assets .......................... 105,181 109,560 109,632 115,224 115,292
Claims and claim adjustment expense reserves . 51,131 53,127 54,723 57,700 59,288
Total long-term debt .................... 6,502 6,154 5,939 5,590 4,646
Total liabilities ........................ 79,706 82,145 84,313 88,608 90,157
Total shareholders’ equity ................ 25,475 27,415 25,319 26,616 25,135
Net income per share(1):
Basic ............................... $ 6.69 $ 6.38 $ 4.87 $ 7.00 $ 6.07
Diluted ............................. $ 6.62 $ 6.33 $ 4.81 $ 6.85 $ 5.89
Year-end common shares outstanding ....... 434.6 520.3 585.1 627.8 678.3
Per common share amounts:
Cash dividends ........................ $ 1.41 $ 1.23 $ 1.19 $ 1.13 $ 1.01
Book value .......................... $ 58.47 $ 52.54 $ 43.12 $ 42.22 $ 36.86
(1) On January 1, 2009, the Company adopted the FASB’s updated accounting guidance related to
earnings per share. The impact of the adoption of this guidance was a reduction of previously
reported basic earnings per share by $0.03, $0.04 and $0.05 per share for the years ended
December 31, 2008, 2007 and 2006, respectively, and a reduction of previously reported diluted
earnings per share by $0.01, $0.01 and $0.02 per share for the years ended December 31, 2008,
2007 and 2006, respectively.
68