Travelers 2010 Annual Report Download - page 190
Download and view the complete annual report
Please find page 190 of the 2010 Travelers annual report below. You can navigate through the pages in the report by either clicking on the pages listed below, or by using the keyword search tool below to find specific information within the annual report.-
 1
1 -
2
-
3
-
4
-
5
-
6
-
7
-
8
-
9
-
10
-
11
-
12
-
13
-
14
-
15
-
16
-
17
-
18
-
19
-
20
-
21
-
22
-
23
-
24
-
25
-
26
-
27
-
28
-
29
-
30
-
31
-
32
-
33
-
34
-
35
-
36
-
37
-
38
-
39
-
40
-
41
-
42
-
43
-
44
-
45
-
46
-
47
-
48
-
49
-
50
-
51
-
52
-
53
-
54
-
55
-
56
-
57
-
58
-
59
-
60
-
61
-
62
-
63
-
64
-
65
-
66
-
67
-
68
-
69
-
70
-
71
-
72
-
73
-
74
-
75
-
76
-
77
-
78
-
79
-
80
-
81
-
82
-
83
-
84
-
85
-
86
-
87
-
88
-
89
-
90
-
91
-
92
-
93
-
94
-
95
-
96
-
97
-
98
-
99
-
100
-
101
-
102
-
103
-
104
-
105
-
106
-
107
-
108
-
109
-
110
-
111
-
112
-
113
-
114
-
115
-
116
-
117
-
118
-
119
-
120
-
121
-
122
-
123
-
124
-
125
-
126
-
127
-
128
-
129
-
130
-
131
-
132
-
133
-
134
-
135
-
136
-
137
-
138
-
139
-
140
-
141
-
142
-
143
-
144
-
145
-
146
-
147
-
148
-
149
-
150
-
151
-
152
-
153
-
154
-
155
-
156
-
157
-
158
-
159
-
160
-
161
-
162
-
163
-
164
-
165
-
166
-
167
-
168
-
169
-
170
-
171
-
172
-
173
-
174
-
175
-
176
-
177
-
178
-
179
-
 180
180 -
 181
181 -
 182
182 -
 183
183 -
 184
184 -
 185
185 -
 186
186 -
 187
187 -
 188
188 -
 189
189 -
 190
190 -
 191
191 -
 192
192 -
 193
193 -
 194
194 -
 195
195 -
 196
196 -
 197
197 -
 198
198 -
 199
199 -
 200
200 -
201
-
202
-
203
-
204
-
205
-
206
-
207
-
208
-
209
-
210
-
211
-
212
-
213
-
214
-
215
-
216
-
217
-
218
-
219
-
220
-
221
-
222
-
223
-
224
-
225
-
226
-
227
-
228
-
229
-
230
-
231
-
232
-
233
-
234
-
235
-
236
-
237
-
238
-
239
-
240
-
241
-
242
-
243
-
244
-
245
-
246
-
247
-
248
-
249
-
250
-
251
-
252
-
253
-
254
-
255
-
256
-
257
-
258
-
259
-
260
-
261
-
262
-
263
-
264
-
265
-
266
-
267
-
268
-
269
-
270
-
271
-
272
-
273
-
274
-
275
-
276
-
277
-
278
-
279
-
280
-
281
-
282
-
283
-
284
-
285
-
286
-
287
-
288
-
289
-
290
-
291
-
292
 |
 |

THE TRAVELERS COMPANIES, INC. AND SUBSIDIARIES
NOTES TO CONSOLIDATED FINANCIAL STATEMENTS (Continued)
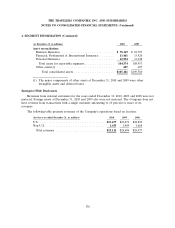
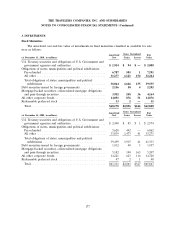
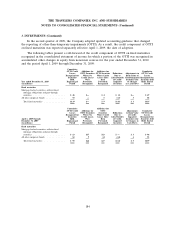
3. INVESTMENTS (Continued)
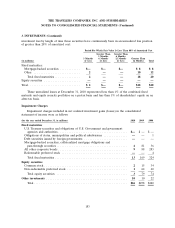
The amortized cost and fair value of fixed maturities by contractual maturity follow. Actual
maturities will differ from contractual maturities because borrowers may have the right to call or
prepay obligations with or without call or prepayment penalties.
Amortized Fair
(at December 31, 2010, in millions) Cost Value
Due in one year or less .............................. $ 5,257 $ 5,340
Due after 1 year through 5 years ....................... 19,478 20,675
Due after 5 years through 10 years ...................... 16,273 17,242
Due after 10 years .................................. 15,210 15,399
56,218 58,656
Mortgage-backed securities, collateralized mortgage obligations
and pass-through securities .......................... 3,952 4,164
Total .......................................... $60,170 $62,820
Pre-refunded bonds of $7.29 billion and $6.06 billion at December 31, 2010 and 2009, respectively,
were bonds for which an irrevocable trust has been established to fund the remaining payments of
principal and interest.
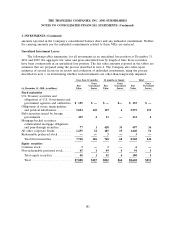
The Company’s fixed maturity investment portfolio at December 31, 2010 and 2009 included $4.16
billion and $5.21 billion, respectively, of residential mortgage-backed securities, which include pass-
through-securities and collateralized mortgage obligations (CMO). Included in the totals at
December 31, 2010 and 2009 were $2.09 billion and $2.63 billion, respectively, of GNMA, FNMA and
FHLMC (excluding FHA project loans) guaranteed residential mortgage-backed pass-through securities
classified as available for sale. Also included in those totals were residential CMOs classified as
available for sale with a fair value of $2.07 billion and $2.58 billion, respectively. Approximately 38%
and 37% of the Company’s CMO holdings were guaranteed by or fully collateralized by securities
issued by GNMA, FNMA or FHLMC at December 31, 2010 and 2009, respectively. The average credit
rating of all of the above securities was ‘Aa1‘ at both December 31, 2010 and 2009.
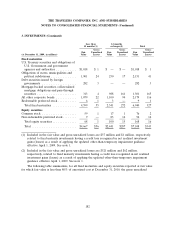
At December 31, 2010 and 2009, the Company held commercial mortgage-backed securities
(CMBS, including FHA project loans) of $549 million and $714 million, respectively, which are
included in ‘‘All other corporate bonds’’ in the tables above. At December 31, 2010 and 2009,
approximately $155 million and $236 million of these securities, respectively, or the loans backing such
securities, contained guarantees by the U.S. government or a government-sponsored enterprise, and
$20 million at both dates were comprised of Canadian non-guaranteed securities. The average credit
rating of the $394 million of non-guaranteed securities at December 31, 2010 was ‘‘Aaa,’’ and 90% of
those securities were issued in 2004 and prior years. The CMBS portfolio is supported by loans that are
diversified across economic sectors and geographical areas.
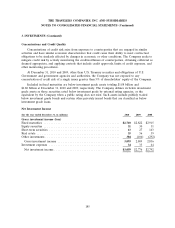
At December 31, 2010 and 2009, the Company had $186 million and $90 million, respectively, of
securities on loan as part of a tri-party lending agreement.
Proceeds from sales of fixed maturities classified as available for sale were $3.71 billion,
$2.81 billion and $6.93 billion in 2010, 2009 and 2008, respectively. Gross gains of $106 million,
$119 million and $121 million and gross losses of $11 million, $19 million and $168 million were
realized on sales in 2010, 2009 and 2008, respectively.
178