Travelers 2010 Annual Report Download - page 194
Download and view the complete annual report
Please find page 194 of the 2010 Travelers annual report below. You can navigate through the pages in the report by either clicking on the pages listed below, or by using the keyword search tool below to find specific information within the annual report.-
 1
1 -
2
-
3
-
4
-
5
-
6
-
7
-
8
-
9
-
10
-
11
-
12
-
13
-
14
-
15
-
16
-
17
-
18
-
19
-
20
-
21
-
22
-
23
-
24
-
25
-
26
-
27
-
28
-
29
-
30
-
31
-
32
-
33
-
34
-
35
-
36
-
37
-
38
-
39
-
40
-
41
-
42
-
43
-
44
-
45
-
46
-
47
-
48
-
49
-
50
-
51
-
52
-
53
-
54
-
55
-
56
-
57
-
58
-
59
-
60
-
61
-
62
-
63
-
64
-
65
-
66
-
67
-
68
-
69
-
70
-
71
-
72
-
73
-
74
-
75
-
76
-
77
-
78
-
79
-
80
-
81
-
82
-
83
-
84
-
85
-
86
-
87
-
88
-
89
-
90
-
91
-
92
-
93
-
94
-
95
-
96
-
97
-
98
-
99
-
100
-
101
-
102
-
103
-
104
-
105
-
106
-
107
-
108
-
109
-
110
-
111
-
112
-
113
-
114
-
115
-
116
-
117
-
118
-
119
-
120
-
121
-
122
-
123
-
124
-
125
-
126
-
127
-
128
-
129
-
130
-
131
-
132
-
133
-
134
-
135
-
136
-
137
-
138
-
139
-
140
-
141
-
142
-
143
-
144
-
145
-
146
-
147
-
148
-
149
-
150
-
151
-
152
-
153
-
154
-
155
-
156
-
157
-
158
-
159
-
160
-
161
-
162
-
163
-
164
-
165
-
166
-
167
-
168
-
169
-
170
-
171
-
172
-
173
-
174
-
175
-
176
-
177
-
178
-
179
-
180
-
181
-
182
-
183
-
 184
184 -
 185
185 -
 186
186 -
 187
187 -
 188
188 -
 189
189 -
 190
190 -
 191
191 -
 192
192 -
 193
193 -
 194
194 -
 195
195 -
 196
196 -
 197
197 -
 198
198 -
 199
199 -
 200
200 -
 201
201 -
 202
202 -
 203
203 -
 204
204 -
205
-
206
-
207
-
208
-
209
-
210
-
211
-
212
-
213
-
214
-
215
-
216
-
217
-
218
-
219
-
220
-
221
-
222
-
223
-
224
-
225
-
226
-
227
-
228
-
229
-
230
-
231
-
232
-
233
-
234
-
235
-
236
-
237
-
238
-
239
-
240
-
241
-
242
-
243
-
244
-
245
-
246
-
247
-
248
-
249
-
250
-
251
-
252
-
253
-
254
-
255
-
256
-
257
-
258
-
259
-
260
-
261
-
262
-
263
-
264
-
265
-
266
-
267
-
268
-
269
-
270
-
271
-
272
-
273
-
274
-
275
-
276
-
277
-
278
-
279
-
280
-
281
-
282
-
283
-
284
-
285
-
286
-
287
-
288
-
289
-
290
-
291
-
292
 |
 |

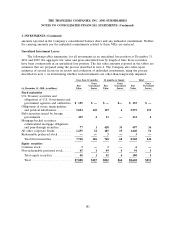
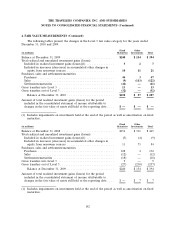
THE TRAVELERS COMPANIES, INC. AND SUBSIDIARIES
NOTES TO CONSOLIDATED FINANCIAL STATEMENTS (Continued)
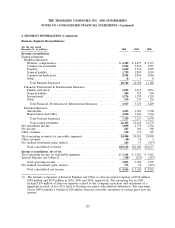
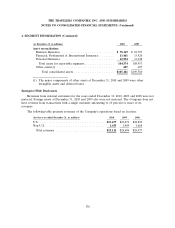
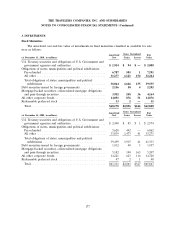
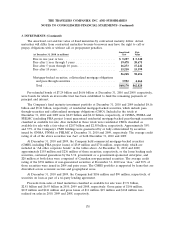
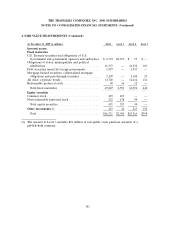
3. INVESTMENTS (Continued)
Less than 12 months
12 months(1) or longer(2) Total
Gross Gross Gross
Fair Unrealized Fair Unrealized Fair Unrealized
(at December 31, 2009, in millions) Value Losses Value Losses Value Losses
Fixed maturities
U.S. Treasury securities and obligations of
U.S. Government and government
agencies and authorities ............ $1,018 $ 1 $ — $ — $1,018 $ 1
Obligations of states, municipalities and
political subdivisions ............... 1,901 24 250 17 2,151 41
Debt securities issued by foreign
governments .................... 282 3 — — 282 3
Mortgage-backed securities, collateralized
mortgage obligations and pass-through
securities ....................... 313 4 988 161 1,301 165
All other corporate bonds ............ 1,079 22 1,100 94 2,179 116
Redeemable preferred stock ........... 6 1 3 — 9 1
Total fixed maturities .............. 4,599 55 2,341 272 6,940 327
Equity securities
Common stock .................... 59 1 17 1 76 2
Non-redeemable preferred stock ........ 9 — 83 14 92 14
Total equity securities .............. 68 1 100 15 168 16
Total .......................... $4,667 $56 $2,441 $287 $7,108 $343
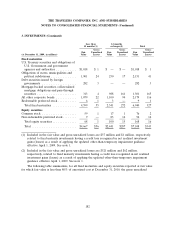
(1) Included in the fair value and gross unrealized losses are $37 million and $1 million, respectively,
related to fixed maturity investments having a credit loss recognized in net realized investment
gains (losses) as a result of applying the updated other-than-temporary impairment guidance
effective April 1, 2009. See note 1.
(2) Included in the fair value and gross unrealized losses are $521 million and $62 million,
respectively, related to fixed maturity investments having a credit loss recognized in net realized
investment gains (losses) as a result of applying the updated other-than-temporary impairment
guidance effective April 1, 2009. See note 1.
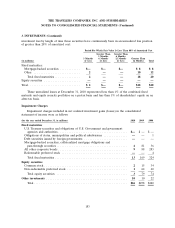
The following table summarizes, for all fixed maturities and equity securities reported at fair value
for which fair value is less than 80% of amortized cost at December 31, 2010, the gross unrealized
182