Travelers 2010 Annual Report Download - page 117
Download and view the complete annual report
Please find page 117 of the 2010 Travelers annual report below. You can navigate through the pages in the report by either clicking on the pages listed below, or by using the keyword search tool below to find specific information within the annual report.-
 1
1 -
2
-
3
-
4
-
5
-
6
-
7
-
8
-
9
-
10
-
11
-
12
-
13
-
14
-
15
-
16
-
17
-
18
-
19
-
20
-
21
-
22
-
23
-
24
-
25
-
26
-
27
-
28
-
29
-
30
-
31
-
32
-
33
-
34
-
35
-
36
-
37
-
38
-
39
-
40
-
41
-
42
-
43
-
44
-
45
-
46
-
47
-
48
-
49
-
50
-
51
-
52
-
53
-
54
-
55
-
56
-
57
-
58
-
59
-
60
-
61
-
62
-
63
-
64
-
65
-
66
-
67
-
68
-
69
-
70
-
71
-
72
-
73
-
74
-
75
-
76
-
77
-
78
-
79
-
80
-
81
-
82
-
83
-
84
-
85
-
86
-
87
-
88
-
89
-
90
-
91
-
92
-
93
-
94
-
95
-
96
-
97
-
98
-
99
-
100
-
101
-
102
-
103
-
104
-
105
-
106
-
 107
107 -
 108
108 -
 109
109 -
 110
110 -
 111
111 -
 112
112 -
 113
113 -
 114
114 -
 115
115 -
 116
116 -
 117
117 -
 118
118 -
 119
119 -
 120
120 -
 121
121 -
 122
122 -
 123
123 -
 124
124 -
 125
125 -
 126
126 -
 127
127 -
128
-
129
-
130
-
131
-
132
-
133
-
134
-
135
-
136
-
137
-
138
-
139
-
140
-
141
-
142
-
143
-
144
-
145
-
146
-
147
-
148
-
149
-
150
-
151
-
152
-
153
-
154
-
155
-
156
-
157
-
158
-
159
-
160
-
161
-
162
-
163
-
164
-
165
-
166
-
167
-
168
-
169
-
170
-
171
-
172
-
173
-
174
-
175
-
176
-
177
-
178
-
179
-
180
-
181
-
182
-
183
-
184
-
185
-
186
-
187
-
188
-
189
-
190
-
191
-
192
-
193
-
194
-
195
-
196
-
197
-
198
-
199
-
200
-
201
-
202
-
203
-
204
-
205
-
206
-
207
-
208
-
209
-
210
-
211
-
212
-
213
-
214
-
215
-
216
-
217
-
218
-
219
-
220
-
221
-
222
-
223
-
224
-
225
-
226
-
227
-
228
-
229
-
230
-
231
-
232
-
233
-
234
-
235
-
236
-
237
-
238
-
239
-
240
-
241
-
242
-
243
-
244
-
245
-
246
-
247
-
248
-
249
-
250
-
251
-
252
-
253
-
254
-
255
-
256
-
257
-
258
-
259
-
260
-
261
-
262
-
263
-
264
-
265
-
266
-
267
-
268
-
269
-
270
-
271
-
272
-
273
-
274
-
275
-
276
-
277
-
278
-
279
-
280
-
281
-
282
-
283
-
284
-
285
-
286
-
287
-
288
-
289
-
290
-
291
-
292
 |
 |
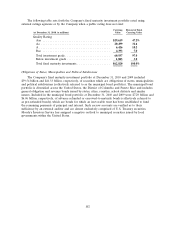
position or liquidity, due to the portfolio’s relatively small size and the underlying credit strength of
these securities.
Alternative Documentation Mortgages and Sub-Prime Mortgages
At December 31, 2010 and 2009, the ‘‘mortgage-backed securities, collateralized mortgage
obligations and pass-through securities’’ and ‘‘asset-backed and other’’ categories in the foregoing table
included collateralized mortgage obligations backed by alternative documentation mortgages and asset-
backed securities collateralized by sub-prime mortgages with a collective fair value of $297 million and
$270 million, respectively (comprising approximately 0.5% and 0.4% of the Company’s total fixed
maturity investments at December 31, 2010 and 2009, respectively). The disruption in secondary
investment markets for mortgage-backed securities provided the Company with the opportunity to
selectively acquire additional such securities at discounted prices. The Company purchased $31 million
and $74 million of such securities in the years ended December 31, 2010 and 2009, respectively. The
Company defines sub-prime mortgage-backed securities as investments in which the underlying loans
primarily exhibit one or more of the following characteristics: low FICO scores, above-prime interest
rates, high loan-to-value ratios or high debt-to-income ratios. Alternative documentation securitizations
are those in which the underlying loans primarily meet the government-sponsored entities’ requirements
for credit score but do not meet the government-sponsored entities’ guidelines for documentation,
property type, debt and loan-to-value ratios. The average credit rating on these securities and
obligations held by the Company was ‘‘Baa2’’ and ‘‘A3’’ at December 31, 2010 and 2009, respectively.
Equity Securities Available for Sale, Real Estate and Short-Term Securities
See note 1 of notes to the Company’s consolidated financial statements for further information
about these invested asset classes.
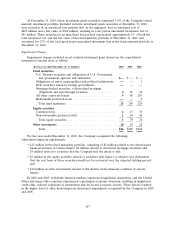
Other Investments
At December 31, 2010 and 2009, the carrying value of the Company’s other investments was
$2.93 billion and $2.95 billion, respectively. The Company’s other investments are primarily comprised
of private equity limited partnerships, hedge funds, real estate partnerships, joint ventures, mortgage
loans, venture capital (through direct ownership and limited partnerships) and trading securities, which
are subject to more volatility than the Company’s fixed maturity investments. These asset classes have
historically provided a higher return than fixed maturities but are subject to more volatility. Net
investment income provided by these asset classes totaled $304 million in 2010, compared with negative
net investment income of $106 million and $292 million in 2009 and 2008, respectively. The negative
net investment income in 2009 and 2008 reflected market conditions.
Securities Lending
The Company has engaged in securities lending activities from which it generates net investment
income by lending certain of its investments to other institutions for short periods of time. The
Company has not incurred any investment losses in its securities lending program for the years ended
December 31, 2010, 2009 and 2008.
105