Travelers 2010 Annual Report Download - page 97
Download and view the complete annual report
Please find page 97 of the 2010 Travelers annual report below. You can navigate through the pages in the report by either clicking on the pages listed below, or by using the keyword search tool below to find specific information within the annual report.-
 1
1 -
2
-
3
-
4
-
5
-
6
-
7
-
8
-
9
-
10
-
11
-
12
-
13
-
14
-
15
-
16
-
17
-
18
-
19
-
20
-
21
-
22
-
23
-
24
-
25
-
26
-
27
-
28
-
29
-
30
-
31
-
32
-
33
-
34
-
35
-
36
-
37
-
38
-
39
-
40
-
41
-
42
-
43
-
44
-
45
-
46
-
47
-
48
-
49
-
50
-
51
-
52
-
53
-
54
-
55
-
56
-
57
-
58
-
59
-
60
-
61
-
62
-
63
-
64
-
65
-
66
-
67
-
68
-
69
-
70
-
71
-
72
-
73
-
74
-
75
-
76
-
77
-
78
-
79
-
80
-
81
-
82
-
83
-
84
-
85
-
86
-
 87
87 -
 88
88 -
 89
89 -
 90
90 -
 91
91 -
 92
92 -
 93
93 -
 94
94 -
 95
95 -
 96
96 -
 97
97 -
 98
98 -
 99
99 -
 100
100 -
 101
101 -
 102
102 -
 103
103 -
 104
104 -
 105
105 -
 106
106 -
 107
107 -
108
-
109
-
110
-
111
-
112
-
113
-
114
-
115
-
116
-
117
-
118
-
119
-
120
-
121
-
122
-
123
-
124
-
125
-
126
-
127
-
128
-
129
-
130
-
131
-
132
-
133
-
134
-
135
-
136
-
137
-
138
-
139
-
140
-
141
-
142
-
143
-
144
-
145
-
146
-
147
-
148
-
149
-
150
-
151
-
152
-
153
-
154
-
155
-
156
-
157
-
158
-
159
-
160
-
161
-
162
-
163
-
164
-
165
-
166
-
167
-
168
-
169
-
170
-
171
-
172
-
173
-
174
-
175
-
176
-
177
-
178
-
179
-
180
-
181
-
182
-
183
-
184
-
185
-
186
-
187
-
188
-
189
-
190
-
191
-
192
-
193
-
194
-
195
-
196
-
197
-
198
-
199
-
200
-
201
-
202
-
203
-
204
-
205
-
206
-
207
-
208
-
209
-
210
-
211
-
212
-
213
-
214
-
215
-
216
-
217
-
218
-
219
-
220
-
221
-
222
-
223
-
224
-
225
-
226
-
227
-
228
-
229
-
230
-
231
-
232
-
233
-
234
-
235
-
236
-
237
-
238
-
239
-
240
-
241
-
242
-
243
-
244
-
245
-
246
-
247
-
248
-
249
-
250
-
251
-
252
-
253
-
254
-
255
-
256
-
257
-
258
-
259
-
260
-
261
-
262
-
263
-
264
-
265
-
266
-
267
-
268
-
269
-
270
-
271
-
272
-
273
-
274
-
275
-
276
-
277
-
278
-
279
-
280
-
281
-
282
-
283
-
284
-
285
-
286
-
287
-
288
-
289
-
290
-
291
-
292
 |
 |
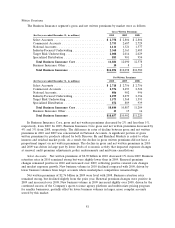
relating to 2007 flood losses. In Bond & Financial Products, better than expected loss development for
the contract surety business within the fidelity and surety product line, resulting from favorable
settlements on large claims (primarily from accident years prior to 2005), resulted in net favorable prior
year reserve development in 2008.
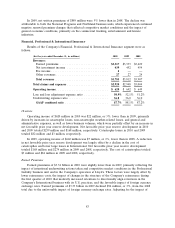
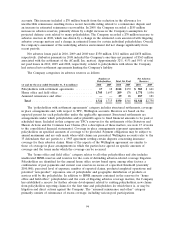
The amortization of deferred acquisition costs totaled $612 million in 2010, $10 million, or 2%,
lower than the comparable 2009 total of $622 million, consistent with the decline in earned premiums.
In 2009, the amortization of deferred acquisition costs totaled $622 million, $30 million, or 5%, lower
than the comparable 2008 total of $652 million, driven by the favorable impact of foreign currency
exchange rates and changes in the mix of business.
General and administrative expenses in 2010 totaled $608 million, $29 million, or 5%, higher than
the 2009 total of $579 million. The increase in 2010 primarily reflected increases in employee- and
technology-related costs to enhance operations and support future business growth. In 2009, general
and administrative expenses of $579 million were slightly lower than the 2008 total of $581 million,
primarily reflecting the favorable impact of foreign currency exchange rates, which was largely offset by
an increase in employee-related expenses associated with growth initiatives.
GAAP Combined Ratio
The GAAP combined ratio of 87.7% in 2010 was 0.4 points lower than the GAAP combined ratio
of 88.1% in 2009.
The loss and loss adjustment expense ratio of 50.9% in 2010 was 1.2 points lower than the 2009
ratio of 52.1%. Catastrophe losses in 2010 and 2009 accounted for 2.4 and 0.1 points of the loss and
loss adjustment expense ratio, respectively. The loss and loss adjustment expense ratios in 2010 and
2009 included 7.8 point and 5.1 point benefits, respectively, from net favorable prior year reserve
development. The loss and loss adjustment expense ratio in 2010 excluding catastrophe losses and prior
year reserve development was 0.8 points lower than the 2009 ratio on the same basis, reflecting lower
reinsurance costs, partially offset by an increase in non-catastrophe weather-related losses. In addition,
the 2009 ratio reflected a reserve increase for a non-renewed professional liability program in Ireland.
The underwriting expense ratio of 36.8% in 2010 was 0.8 points higher than the underwriting
expense ratio of 36.0% in 2009. The increase primarily reflected the impact of increases in employee-
and technology-related costs to enhance operations and support future business growth.
The GAAP combined ratio of 88.1% in 2009 was 0.9 points higher than the GAAP combined ratio
of 87.2% in 2008.
In 2009, the loss and loss adjustment expense ratio of 52.1% was 0.9 points higher than the 2008
ratio of 51.2%. Catastrophe losses in 2009 and 2008 accounted for 0.1 and 2.3 points of the loss and
loss adjustment expense ratio, respectively. The loss and loss adjustment expense ratios in 2009 and
2008 included 5.1 point and 8.0 point benefits, respectively, from net favorable prior year reserve
development. The loss and loss adjustment expense ratio in 2009 adjusted for catastrophe losses and
prior year reserve development was 0.2 points higher than the 2008 ratio on the same basis, as the
impact of loss cost trends was partially offset by the favorable impact of lower large losses in
International.
In 2009, the underwriting expense ratio of 36.0% was level with the underwriting expense ratio in
2008. The 2008 expense ratio included a 0.2 point impact from hurricane-related assessments. Adjusting
for that factor in 2008, the 2009 underwriting expense ratio was 0.2 points higher than the 2008 ratio.
85