Travelers 2010 Annual Report Download - page 86
Download and view the complete annual report
Please find page 86 of the 2010 Travelers annual report below. You can navigate through the pages in the report by either clicking on the pages listed below, or by using the keyword search tool below to find specific information within the annual report.-
 1
1 -
2
-
3
-
4
-
5
-
6
-
7
-
8
-
9
-
10
-
11
-
12
-
13
-
14
-
15
-
16
-
17
-
18
-
19
-
20
-
21
-
22
-
23
-
24
-
25
-
26
-
27
-
28
-
29
-
30
-
31
-
32
-
33
-
34
-
35
-
36
-
37
-
38
-
39
-
40
-
41
-
42
-
43
-
44
-
45
-
46
-
47
-
48
-
49
-
50
-
51
-
52
-
53
-
54
-
55
-
56
-
57
-
58
-
59
-
60
-
61
-
62
-
63
-
64
-
65
-
66
-
67
-
68
-
69
-
70
-
71
-
72
-
73
-
74
-
75
-
 76
76 -
 77
77 -
 78
78 -
 79
79 -
 80
80 -
 81
81 -
 82
82 -
 83
83 -
 84
84 -
 85
85 -
 86
86 -
 87
87 -
 88
88 -
 89
89 -
 90
90 -
 91
91 -
 92
92 -
 93
93 -
 94
94 -
 95
95 -
 96
96 -
97
-
98
-
99
-
100
-
101
-
102
-
103
-
104
-
105
-
106
-
107
-
108
-
109
-
110
-
111
-
112
-
113
-
114
-
115
-
116
-
117
-
118
-
119
-
120
-
121
-
122
-
123
-
124
-
125
-
126
-
127
-
128
-
129
-
130
-
131
-
132
-
133
-
134
-
135
-
136
-
137
-
138
-
139
-
140
-
141
-
142
-
143
-
144
-
145
-
146
-
147
-
148
-
149
-
150
-
151
-
152
-
153
-
154
-
155
-
156
-
157
-
158
-
159
-
160
-
161
-
162
-
163
-
164
-
165
-
166
-
167
-
168
-
169
-
170
-
171
-
172
-
173
-
174
-
175
-
176
-
177
-
178
-
179
-
180
-
181
-
182
-
183
-
184
-
185
-
186
-
187
-
188
-
189
-
190
-
191
-
192
-
193
-
194
-
195
-
196
-
197
-
198
-
199
-
200
-
201
-
202
-
203
-
204
-
205
-
206
-
207
-
208
-
209
-
210
-
211
-
212
-
213
-
214
-
215
-
216
-
217
-
218
-
219
-
220
-
221
-
222
-
223
-
224
-
225
-
226
-
227
-
228
-
229
-
230
-
231
-
232
-
233
-
234
-
235
-
236
-
237
-
238
-
239
-
240
-
241
-
242
-
243
-
244
-
245
-
246
-
247
-
248
-
249
-
250
-
251
-
252
-
253
-
254
-
255
-
256
-
257
-
258
-
259
-
260
-
261
-
262
-
263
-
264
-
265
-
266
-
267
-
268
-
269
-
270
-
271
-
272
-
273
-
274
-
275
-
276
-
277
-
278
-
279
-
280
-
281
-
282
-
283
-
284
-
285
-
286
-
287
-
288
-
289
-
290
-
291
-
292
 |
 |
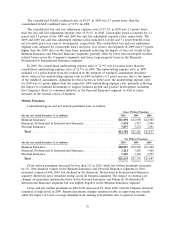
Claims and Expenses
Claims and Claim Adjustment Expenses
Claims and claim adjustment expenses totaled $13.21 billion in 2010, $802 million, or 6%, higher
than the 2009 total of $12.41 billion, primarily reflecting the significant increase in catastrophe losses,
the modest decline in net favorable prior year reserve development and the impact of loss cost trends.
Catastrophe losses in 2010 and 2009 totaled $1.11 billion and $457 million, respectively. Net favorable
prior year reserve development in 2010 and 2009 totaled $1.25 billion and $1.33 billion, respectively.
Catastrophe losses in 2010 primarily resulted from several severe wind and hail storms, as well as
severe winter storms. Catastrophe losses in 2009 primarily resulted from several wind and hail storms,
as well as flooding.
Claims and claim adjustment expenses totaled $12.41 billion in 2009, $585 million, or 5%, lower
than the 2008 total of $12.99 billion, primarily reflecting the significant decline in catastrophe losses,
lower non-catastrophe weather-related losses and fewer large property losses, mostly offset by the
modest decline in net favorable prior year reserve development and the impact of loss cost trends.
Total claims and claim adjustment expenses in 2009 included $457 million for the cost of catastrophes
and $1.33 billion of net favorable prior year reserve development, whereas the comparable 2008 total
included $1.26 billion for the cost of catastrophes and $1.54 billion of net favorable prior year reserve
development. Catastrophe losses in 2008 primarily resulted from Hurricanes Ike, Gustav and Dolly.
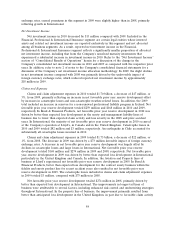
The Company’s three business segments each experienced net favorable prior year reserve
development in 2010, 2009 and 2008. In the Business Insurance segment, net favorable prior year
reserve development totaled $901 million, $1.03 billion and $1.12 billion in 2010, 2009 and 2008,
respectively. In the Financial, Professional & International Insurance segment, net favorable prior year
reserve development in 2010, 2009 and 2008 totaled $259 million, $168 million and $274 million,
respectively. In the Personal Insurance segment, net favorable prior year reserve development totaled
$87 million, $135 million and $143 million, respectively. Factors contributing to net favorable prior year
reserve development are discussed in more detail in the segment discussions that follow.
Amortization of Deferred Acquisition Costs
The amortization of deferred acquisition costs in 2010 totaled $3.80 billion, virtually level with the
2009 total. In 2009, the amortization of deferred acquisition costs totaled $3.81 billion, 2% lower than
the total of $3.88 billion in 2008. Changes in the amortization of deferred acquisition costs in both 2010
and 2009 were consistent with the changes in earned premiums in each year as compared to the
preceding year.
General and Administrative Expenses
In 2010, general and administrative expenses totaled $3.41 billion, an increase of $40 million, or
1%, over the 2009 total of $3.37 billion. The 2009 total included a reduction of $87 million in the
estimate of property windpool assessments related to Hurricane Ike due to a decline in estimated
insurance industry losses related to Hurricane Ike. Excluding that adjustment in 2009, general and
administrative expenses in 2010 were $47 million, or 1%, lower than in 2009. The decline was
concentrated in the Business Insurance segment, and was largely offset by higher expenses in the
Personal Insurance segment resulting from the Company’s direct to consumer initiative and in the
Financial, Professional & International Insurance segment due to employee- and technology-related
costs to enhance operations and support future business growth.
General and administrative expenses totaled $3.37 billion in 2009, a decrease of $152 million, or
4%, from the comparable 2008 total of $3.52 billion. The decrease reflected changes in the estimates of
windpool assessments related to Hurricane Ike. During 2008, the Company recorded $141 million of
74