Travelers 2010 Annual Report Download - page 92
Download and view the complete annual report
Please find page 92 of the 2010 Travelers annual report below. You can navigate through the pages in the report by either clicking on the pages listed below, or by using the keyword search tool below to find specific information within the annual report.-
 1
1 -
2
-
3
-
4
-
5
-
6
-
7
-
8
-
9
-
10
-
11
-
12
-
13
-
14
-
15
-
16
-
17
-
18
-
19
-
20
-
21
-
22
-
23
-
24
-
25
-
26
-
27
-
28
-
29
-
30
-
31
-
32
-
33
-
34
-
35
-
36
-
37
-
38
-
39
-
40
-
41
-
42
-
43
-
44
-
45
-
46
-
47
-
48
-
49
-
50
-
51
-
52
-
53
-
54
-
55
-
56
-
57
-
58
-
59
-
60
-
61
-
62
-
63
-
64
-
65
-
66
-
67
-
68
-
69
-
70
-
71
-
72
-
73
-
74
-
75
-
76
-
77
-
78
-
79
-
80
-
81
-
 82
82 -
 83
83 -
 84
84 -
 85
85 -
 86
86 -
 87
87 -
 88
88 -
 89
89 -
 90
90 -
 91
91 -
 92
92 -
 93
93 -
 94
94 -
 95
95 -
 96
96 -
 97
97 -
 98
98 -
 99
99 -
 100
100 -
 101
101 -
 102
102 -
103
-
104
-
105
-
106
-
107
-
108
-
109
-
110
-
111
-
112
-
113
-
114
-
115
-
116
-
117
-
118
-
119
-
120
-
121
-
122
-
123
-
124
-
125
-
126
-
127
-
128
-
129
-
130
-
131
-
132
-
133
-
134
-
135
-
136
-
137
-
138
-
139
-
140
-
141
-
142
-
143
-
144
-
145
-
146
-
147
-
148
-
149
-
150
-
151
-
152
-
153
-
154
-
155
-
156
-
157
-
158
-
159
-
160
-
161
-
162
-
163
-
164
-
165
-
166
-
167
-
168
-
169
-
170
-
171
-
172
-
173
-
174
-
175
-
176
-
177
-
178
-
179
-
180
-
181
-
182
-
183
-
184
-
185
-
186
-
187
-
188
-
189
-
190
-
191
-
192
-
193
-
194
-
195
-
196
-
197
-
198
-
199
-
200
-
201
-
202
-
203
-
204
-
205
-
206
-
207
-
208
-
209
-
210
-
211
-
212
-
213
-
214
-
215
-
216
-
217
-
218
-
219
-
220
-
221
-
222
-
223
-
224
-
225
-
226
-
227
-
228
-
229
-
230
-
231
-
232
-
233
-
234
-
235
-
236
-
237
-
238
-
239
-
240
-
241
-
242
-
243
-
244
-
245
-
246
-
247
-
248
-
249
-
250
-
251
-
252
-
253
-
254
-
255
-
256
-
257
-
258
-
259
-
260
-
261
-
262
-
263
-
264
-
265
-
266
-
267
-
268
-
269
-
270
-
271
-
272
-
273
-
274
-
275
-
276
-
277
-
278
-
279
-
280
-
281
-
282
-
283
-
284
-
285
-
286
-
287
-
288
-
289
-
290
-
291
-
292
 |
 |
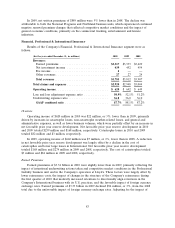
Company’s corporate advertising expense allocated to this segment resulting from a change in focus to
the Personal Insurance segment’s direct to consumer initiative in 2010.
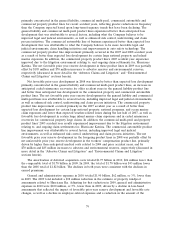
General and administrative expenses in 2009 totaled $1.97 billion, $113 million lower than the
comparable 2008 total of $2.08 billion. The majority of the decrease reflected the impact of estimates
of windpool assessments related to Hurricane Ike in each year. During 2008, the Company recorded
$62 million of hurricane-related assessments in general and administrative expenses. Subsequently,
during the first half of 2009, the Company recorded a $38 million reduction in these assessments due to
a decline in estimated insurance industry losses related to Hurricane Ike.
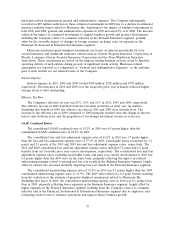
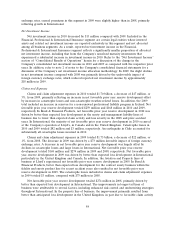
GAAP Combined Ratio
The GAAP combined ratio of 91.3% in 2010 was 5.2 points higher than the GAAP combined ratio
of 86.1% in 2009.
In 2010, the loss and loss adjustment expense ratio of 59.1% was 5.2 points higher than the 2009
ratio of 53.9%. Catastrophe losses in 2010 and 2009 accounted for 4.1 points and 1.6 points of the loss
and loss adjustment expense ratio, respectively. Net favorable prior year reserve development provided
8.4 point and 9.3 point benefits to the loss and loss adjustment expense ratio in 2010 and 2009,
respectively. The loss and loss adjustment expense ratio in 2010 excluding catastrophe losses and prior
year reserve development was 1.8 points higher than the 2009 ratio on the same basis, reflecting the
impact of reduced underwriting margins related to pricing and loss cost trends and a higher number of
large losses.
The underwriting expense ratio of 32.2% in 2010 was level with the 2009 underwriting expense
ratio. The underwriting expense ratio in 2009 included a 0.3 point benefit from the reduction in the
estimate of windpool assessments described above. Adjusting for that factor in 2009, the underwriting
expense ratio for 2010 was 0.3 points lower than the 2009 underwriting expense ratio. The improvement
in the 2010 adjusted expense ratio reflected the decline in expenses described above.
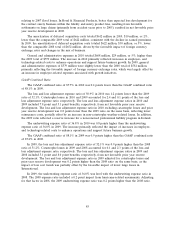
The GAAP combined ratio of 86.1% in 2009 was 4.1 points lower than the GAAP combined ratio
of 90.2% in 2008.
In 2009, the loss and loss adjustment expense ratio of 53.9% was 3.8 points lower than the
comparable 2008 ratio of 57.7%. The cost of catastrophes in 2009 and 2008 accounted for 1.6 points
and 5.7 points of the loss and loss adjustment expense ratio, respectively. Net favorable prior year
reserve development provided 9.3 point and 10.0 point benefits to the loss and loss adjustment expense
ratio in 2009 and 2008, respectively. The loss and loss adjustment expense ratio in 2009 adjusted for the
cost of catastrophes and prior year reserve development was 0.4 points lower than the 2008 ratio on the
same basis, due to lower non-catastrophe weather-related losses and fewer large property losses,
partially offset by reduced underwriting margins related to pricing and loss cost trends.
The underwriting expense ratio of 32.2% in 2009 was 0.3 points lower than the underwriting
expense ratio of 32.5% in 2008. The 2009 underwriting expense ratio included a 0.3 point benefit from
the reduction in the estimate of windpool assessments described above, whereas the underwriting
expense ratio in 2008 included a 0.6 point increase due to the impact from the windpool assessments
and reinstatement premiums. Adjusting for these factors in both years, the underwriting expense ratio
for 2009 was 0.6 points higher than the 2008 underwriting expense ratio, primarily reflecting the
unfavorable impact of the decline in fee income compared with 2008. A portion of fee income is
accounted for as a reduction of expenses for purposes of calculating the expense ratio.
80