Travelers 2010 Annual Report Download - page 95
Download and view the complete annual report
Please find page 95 of the 2010 Travelers annual report below. You can navigate through the pages in the report by either clicking on the pages listed below, or by using the keyword search tool below to find specific information within the annual report.-
 1
1 -
2
-
3
-
4
-
5
-
6
-
7
-
8
-
9
-
10
-
11
-
12
-
13
-
14
-
15
-
16
-
17
-
18
-
19
-
20
-
21
-
22
-
23
-
24
-
25
-
26
-
27
-
28
-
29
-
30
-
31
-
32
-
33
-
34
-
35
-
36
-
37
-
38
-
39
-
40
-
41
-
42
-
43
-
44
-
45
-
46
-
47
-
48
-
49
-
50
-
51
-
52
-
53
-
54
-
55
-
56
-
57
-
58
-
59
-
60
-
61
-
62
-
63
-
64
-
65
-
66
-
67
-
68
-
69
-
70
-
71
-
72
-
73
-
74
-
75
-
76
-
77
-
78
-
79
-
80
-
81
-
82
-
83
-
84
-
 85
85 -
 86
86 -
 87
87 -
 88
88 -
 89
89 -
 90
90 -
 91
91 -
 92
92 -
 93
93 -
 94
94 -
 95
95 -
 96
96 -
 97
97 -
 98
98 -
 99
99 -
 100
100 -
 101
101 -
 102
102 -
 103
103 -
 104
104 -
 105
105 -
106
-
107
-
108
-
109
-
110
-
111
-
112
-
113
-
114
-
115
-
116
-
117
-
118
-
119
-
120
-
121
-
122
-
123
-
124
-
125
-
126
-
127
-
128
-
129
-
130
-
131
-
132
-
133
-
134
-
135
-
136
-
137
-
138
-
139
-
140
-
141
-
142
-
143
-
144
-
145
-
146
-
147
-
148
-
149
-
150
-
151
-
152
-
153
-
154
-
155
-
156
-
157
-
158
-
159
-
160
-
161
-
162
-
163
-
164
-
165
-
166
-
167
-
168
-
169
-
170
-
171
-
172
-
173
-
174
-
175
-
176
-
177
-
178
-
179
-
180
-
181
-
182
-
183
-
184
-
185
-
186
-
187
-
188
-
189
-
190
-
191
-
192
-
193
-
194
-
195
-
196
-
197
-
198
-
199
-
200
-
201
-
202
-
203
-
204
-
205
-
206
-
207
-
208
-
209
-
210
-
211
-
212
-
213
-
214
-
215
-
216
-
217
-
218
-
219
-
220
-
221
-
222
-
223
-
224
-
225
-
226
-
227
-
228
-
229
-
230
-
231
-
232
-
233
-
234
-
235
-
236
-
237
-
238
-
239
-
240
-
241
-
242
-
243
-
244
-
245
-
246
-
247
-
248
-
249
-
250
-
251
-
252
-
253
-
254
-
255
-
256
-
257
-
258
-
259
-
260
-
261
-
262
-
263
-
264
-
265
-
266
-
267
-
268
-
269
-
270
-
271
-
272
-
273
-
274
-
275
-
276
-
277
-
278
-
279
-
280
-
281
-
282
-
283
-
284
-
285
-
286
-
287
-
288
-
289
-
290
-
291
-
292
 |
 |

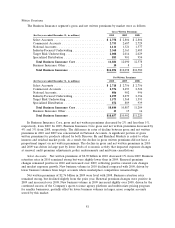
In 2009, net written premiums of $889 million were 5% lower than in 2008. The decline was
attributable to both the National Programs and Northland business units, which experienced continued
negative renewal premium changes that reflected competitive market conditions and the impact of
general economic conditions, primarily on the commercial trucking, entertainment and leisure
industries.
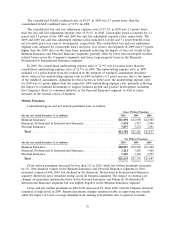
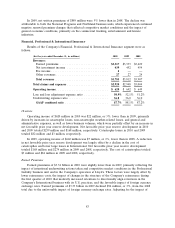
Financial, Professional & International Insurance
Results of the Company’s Financial, Professional & International Insurance segment were as
follows:
(for the year ended December 31, in millions) 2010 2009 2008
Revenues:
Earned premiums ............................ $3,317 $3,333 $3,429
Net investment income ........................ 439 452 454
Fee income ................................. 2——
Other revenues .............................. 27 27 24
Total revenues ............................... $3,785 $3,812 $3,907
Total claims and expenses ........................ $2,920 $2,948 $3,004
Operating income .............................. $ 620 $ 642 $ 649
Loss and loss adjustment expense ratio .............. 50.9% 52.1% 51.2%
Underwriting expense ratio ....................... 36.8 36.0 36.0
GAAP combined ratio ......................... 87.7% 88.1% 87.2%
Overview
Operating income of $620 million in 2010 was $22 million, or 3%, lower than in 2009, primarily
driven by increases in catastrophe losses, non-catastrophe weather-related losses, and general and
administrative expenses, as well as lower business volumes, which were partially offset by an increase in
net favorable prior year reserve development. Net favorable prior year reserve development in 2010
and 2009 totaled $259 million and $168 million, respectively. Catastrophe losses in 2010 and 2009
totaled $82 million and $3 million, respectively.
In 2009, operating income of $642 million was $7 million, or 1%, lower than in 2008. A reduction
in net favorable prior year reserve development was largely offset by a decline in the cost of
catastrophes and lower large losses in International. Net favorable prior year reserve development
totaled $168 million and $274 million in 2009 and 2008, respectively. The cost of catastrophes totaled
$3 million and $84 million in 2009 and 2008, respectively.
Earned Premiums
Earned premiums of $3.32 billion in 2010 were slightly lower than in 2009, primarily reflecting the
impact of intentional underwriting actions taken and competitive market conditions in the Professional
Liability business unit and in the Company’s operation at Lloyd’s. These factors were largely offset by
lower reinsurance costs, the impact of changes in the structure of the Company’s reinsurance during
the first quarter of 2010 that modestly increased retentions to directionally align retentions in the
Company’s International business with its U.S. practices, and the favorable impact of foreign currency
exchange rates. Earned premiums of $3.33 billion in 2009 declined $96 million, or 3%, from the 2008
total due to the unfavorable impact of foreign currency exchange rates. Adjusting for the impact of
83