Travelers 2010 Annual Report Download - page 89
Download and view the complete annual report
Please find page 89 of the 2010 Travelers annual report below. You can navigate through the pages in the report by either clicking on the pages listed below, or by using the keyword search tool below to find specific information within the annual report.-
 1
1 -
2
-
3
-
4
-
5
-
6
-
7
-
8
-
9
-
10
-
11
-
12
-
13
-
14
-
15
-
16
-
17
-
18
-
19
-
20
-
21
-
22
-
23
-
24
-
25
-
26
-
27
-
28
-
29
-
30
-
31
-
32
-
33
-
34
-
35
-
36
-
37
-
38
-
39
-
40
-
41
-
42
-
43
-
44
-
45
-
46
-
47
-
48
-
49
-
50
-
51
-
52
-
53
-
54
-
55
-
56
-
57
-
58
-
59
-
60
-
61
-
62
-
63
-
64
-
65
-
66
-
67
-
68
-
69
-
70
-
71
-
72
-
73
-
74
-
75
-
76
-
77
-
78
-
 79
79 -
 80
80 -
 81
81 -
 82
82 -
 83
83 -
 84
84 -
 85
85 -
 86
86 -
 87
87 -
 88
88 -
 89
89 -
 90
90 -
 91
91 -
 92
92 -
 93
93 -
 94
94 -
 95
95 -
 96
96 -
 97
97 -
 98
98 -
 99
99 -
100
-
101
-
102
-
103
-
104
-
105
-
106
-
107
-
108
-
109
-
110
-
111
-
112
-
113
-
114
-
115
-
116
-
117
-
118
-
119
-
120
-
121
-
122
-
123
-
124
-
125
-
126
-
127
-
128
-
129
-
130
-
131
-
132
-
133
-
134
-
135
-
136
-
137
-
138
-
139
-
140
-
141
-
142
-
143
-
144
-
145
-
146
-
147
-
148
-
149
-
150
-
151
-
152
-
153
-
154
-
155
-
156
-
157
-
158
-
159
-
160
-
161
-
162
-
163
-
164
-
165
-
166
-
167
-
168
-
169
-
170
-
171
-
172
-
173
-
174
-
175
-
176
-
177
-
178
-
179
-
180
-
181
-
182
-
183
-
184
-
185
-
186
-
187
-
188
-
189
-
190
-
191
-
192
-
193
-
194
-
195
-
196
-
197
-
198
-
199
-
200
-
201
-
202
-
203
-
204
-
205
-
206
-
207
-
208
-
209
-
210
-
211
-
212
-
213
-
214
-
215
-
216
-
217
-
218
-
219
-
220
-
221
-
222
-
223
-
224
-
225
-
226
-
227
-
228
-
229
-
230
-
231
-
232
-
233
-
234
-
235
-
236
-
237
-
238
-
239
-
240
-
241
-
242
-
243
-
244
-
245
-
246
-
247
-
248
-
249
-
250
-
251
-
252
-
253
-
254
-
255
-
256
-
257
-
258
-
259
-
260
-
261
-
262
-
263
-
264
-
265
-
266
-
267
-
268
-
269
-
270
-
271
-
272
-
273
-
274
-
275
-
276
-
277
-
278
-
279
-
280
-
281
-
282
-
283
-
284
-
285
-
286
-
287
-
288
-
289
-
290
-
291
-
292
 |
 |

conditions. New business volume declined slightly from 2008, as modest growth in the Business
Insurance segment was offset by lower new business volume in the Financial, Professional &
International Insurance and Personal Insurance segments.
RESULTS OF OPERATIONS BY SEGMENT
Business Insurance
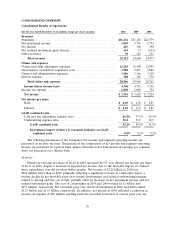
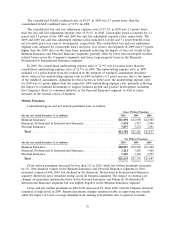
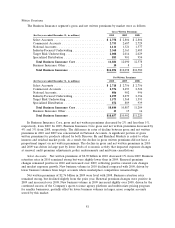
Results of the Company’s Business Insurance segment were as follows:
(for the year ended December 31, in millions) 2010 2009 2008
Revenues:
Earned premiums .......................... $10,766 $10,968 $11,180
Net investment income ...................... 2,156 1,902 1,917
Fee income .............................. 285 306 390
Other revenues ........................... 28 42 30
Total revenues .......................... $13,235 $13,218 $13,517
Total claims and expenses ..................... $10,157 $ 9,778 $10,506
Operating income ........................... $ 2,301 $ 2,590 $ 2,338
Loss and loss adjustment expense ratio ............ 59.1% 53.9% 57.7%
Underwriting expense ratio .................... 32.2 32.2 32.5
GAAP combined ratio ..................... 91.3% 86.1% 90.2%
Overview
Operating income of $2.30 billion in 2010 was $289 million, or 11%, lower than 2009 operating
income of $2.59 billion, primarily reflecting the significant increase in catastrophe losses, the modest
decline in net favorable prior year reserve development, reduced underwriting margins related to
pricing and loss cost trends and a higher number of large losses, partially offset by an increase in net
investment income and a decline in general and administrative expenses. In addition, operating income
in 2009 included benefits of $42 million from the favorable resolution of various prior year tax matters
and a $38 million reduction in the estimate of property windpool assessments related to Hurricane Ike.
Catastrophe losses in 2010 totaled $437 million, compared with $176 million in 2009. Net favorable
prior year reserve development totaled $901 million in 2010, compared with $1.03 billion in 2009.
In 2009, operating income of $2.59 billion was $252 million, or 11%, higher than 2008 operating
income of $2.34 billion, primarily reflecting the significant decline in catastrophe losses, which was
partially offset by reduced underwriting margins and fee income. Catastrophe losses in 2009 and 2008
totaled $176 million and $706 million, respectively. The 2008 total was principally comprised of
$642 million of claims and claim adjustment expenses and $62 million of property windpool assessments
that were included in general and administrative expenses. Net favorable prior year reserve
development totaled $1.03 billion and $1.12 billion in 2009 and 2008, respectively. Operating income in
2009 also included the favorable resolution of various prior year tax matters and reduction in the
estimate of property windpool assessments benefits described above.
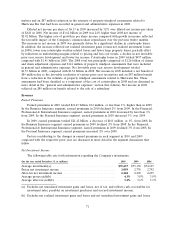
Earned Premiums
Earned premiums of $10.77 billon in 2010 decreased $202 million, or 2%, from 2009. In 2009,
earned premiums of $10.97 billion decreased $212 million, or 2%, from 2008. The declines in both
years were primarily attributable to reduced insured exposures due to lower levels of economic activity.
77