Travelers 2010 Annual Report Download - page 130
Download and view the complete annual report
Please find page 130 of the 2010 Travelers annual report below. You can navigate through the pages in the report by either clicking on the pages listed below, or by using the keyword search tool below to find specific information within the annual report.-
 1
1 -
2
-
3
-
4
-
5
-
6
-
7
-
8
-
9
-
10
-
11
-
12
-
13
-
14
-
15
-
16
-
17
-
18
-
19
-
20
-
21
-
22
-
23
-
24
-
25
-
26
-
27
-
28
-
29
-
30
-
31
-
32
-
33
-
34
-
35
-
36
-
37
-
38
-
39
-
40
-
41
-
42
-
43
-
44
-
45
-
46
-
47
-
48
-
49
-
50
-
51
-
52
-
53
-
54
-
55
-
56
-
57
-
58
-
59
-
60
-
61
-
62
-
63
-
64
-
65
-
66
-
67
-
68
-
69
-
70
-
71
-
72
-
73
-
74
-
75
-
76
-
77
-
78
-
79
-
80
-
81
-
82
-
83
-
84
-
85
-
86
-
87
-
88
-
89
-
90
-
91
-
92
-
93
-
94
-
95
-
96
-
97
-
98
-
99
-
100
-
101
-
102
-
103
-
104
-
105
-
106
-
107
-
108
-
109
-
110
-
111
-
112
-
113
-
114
-
115
-
116
-
117
-
118
-
119
-
 120
120 -
 121
121 -
 122
122 -
 123
123 -
 124
124 -
 125
125 -
 126
126 -
 127
127 -
 128
128 -
 129
129 -
 130
130 -
 131
131 -
 132
132 -
 133
133 -
 134
134 -
 135
135 -
 136
136 -
 137
137 -
 138
138 -
 139
139 -
 140
140 -
141
-
142
-
143
-
144
-
145
-
146
-
147
-
148
-
149
-
150
-
151
-
152
-
153
-
154
-
155
-
156
-
157
-
158
-
159
-
160
-
161
-
162
-
163
-
164
-
165
-
166
-
167
-
168
-
169
-
170
-
171
-
172
-
173
-
174
-
175
-
176
-
177
-
178
-
179
-
180
-
181
-
182
-
183
-
184
-
185
-
186
-
187
-
188
-
189
-
190
-
191
-
192
-
193
-
194
-
195
-
196
-
197
-
198
-
199
-
200
-
201
-
202
-
203
-
204
-
205
-
206
-
207
-
208
-
209
-
210
-
211
-
212
-
213
-
214
-
215
-
216
-
217
-
218
-
219
-
220
-
221
-
222
-
223
-
224
-
225
-
226
-
227
-
228
-
229
-
230
-
231
-
232
-
233
-
234
-
235
-
236
-
237
-
238
-
239
-
240
-
241
-
242
-
243
-
244
-
245
-
246
-
247
-
248
-
249
-
250
-
251
-
252
-
253
-
254
-
255
-
256
-
257
-
258
-
259
-
260
-
261
-
262
-
263
-
264
-
265
-
266
-
267
-
268
-
269
-
270
-
271
-
272
-
273
-
274
-
275
-
276
-
277
-
278
-
279
-
280
-
281
-
282
-
283
-
284
-
285
-
286
-
287
-
288
-
289
-
290
-
291
-
292
 |
 |

From the inception of the first authorization in May 2006 through December 31, 2010, the
Company repurchased a cumulative total of 288.9 million shares for a total cost of $14.49 billion, or
$50.15 per share.
In 2010, 2009 and 2008, the Company acquired 1.3 million, 1.5 million and 0.8 million shares,
respectively, of common stock from employees as treasury stock primarily to cover payroll withholding
taxes related to the vesting of restricted stock awards and exercises of stock options.
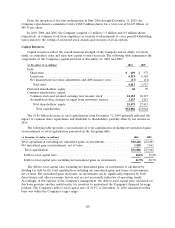
Capital Resources
Capital resources reflect the overall financial strength of the Company and its ability to borrow
funds at competitive rates and raise new capital to meet its needs. The following table summarizes the
components of the Company’s capital structure at December 31, 2010 and 2009.
(at December 31, in millions) 2010 2009
Debt:
Short-term ............................................. $ 109 $ 373
Long-term ............................................. 6,519 6,165
Net unamortized fair value adjustments and debt issuance costs ...... (17) (11)
Total debt ............................................ 6,611 6,527
Preferred shareholders’ equity ................................ 68 79
Common shareholders’ equity:
Common stock and retained earnings, less treasury stock ........... 24,152 26,117
Accumulated other changes in equity from nonowner sources ........ 1,255 1,219
Total shareholders’ equity ................................ 25,475 27,415
Total capitalization .................................... $32,086 $33,942
The $1.86 billion decrease in total capitalization from December 31, 2009 primarily reflected the
impact of common share repurchases and dividends to shareholders, partially offset by net income in
2010.
The following table provides a reconciliation of total capitalization excluding net unrealized gains
on investments to total capitalization presented in the foregoing table.
(at December 31, dollars in millions) 2010 2009
Total capitalization excluding net unrealized gains on investments ............. $30,228 $32,081
Net unrealized gain on investments, net of taxes .......................... 1,858 1,861
Total capitalization .............................................. $32,086 $33,942
Debt-to-total capital ratio ......................................... 20.6% 19.2%
Debt-to-total capital ratio excluding net unrealized gains on investments ....... 21.9% 20.3%
The debt-to-total capital ratio excluding net unrealized gains on investments is calculated by
dividing (a) debt by (b) total capitalization excluding net unrealized gains and losses on investments,
net of taxes. Net unrealized gains and losses on investments can be significantly impacted by both
discretionary and other economic factors and are not necessarily indicative of operating trends.
Accordingly, in the opinion of the Company’s management, the debt-to-total capital ratio calculated on
this basis provides another useful metric for investors to understand the Company’s financial leverage
position. The Company’s debt-to-total capital ratio of 21.9% at December 31, 2010 calculated on this
basis was within the Company’s target range.
118