Travelers 2010 Annual Report Download - page 115
Download and view the complete annual report
Please find page 115 of the 2010 Travelers annual report below. You can navigate through the pages in the report by either clicking on the pages listed below, or by using the keyword search tool below to find specific information within the annual report.-
 1
1 -
2
-
3
-
4
-
5
-
6
-
7
-
8
-
9
-
10
-
11
-
12
-
13
-
14
-
15
-
16
-
17
-
18
-
19
-
20
-
21
-
22
-
23
-
24
-
25
-
26
-
27
-
28
-
29
-
30
-
31
-
32
-
33
-
34
-
35
-
36
-
37
-
38
-
39
-
40
-
41
-
42
-
43
-
44
-
45
-
46
-
47
-
48
-
49
-
50
-
51
-
52
-
53
-
54
-
55
-
56
-
57
-
58
-
59
-
60
-
61
-
62
-
63
-
64
-
65
-
66
-
67
-
68
-
69
-
70
-
71
-
72
-
73
-
74
-
75
-
76
-
77
-
78
-
79
-
80
-
81
-
82
-
83
-
84
-
85
-
86
-
87
-
88
-
89
-
90
-
91
-
92
-
93
-
94
-
95
-
96
-
97
-
98
-
99
-
100
-
101
-
102
-
103
-
104
-
 105
105 -
 106
106 -
 107
107 -
 108
108 -
 109
109 -
 110
110 -
 111
111 -
 112
112 -
 113
113 -
 114
114 -
 115
115 -
 116
116 -
 117
117 -
 118
118 -
 119
119 -
 120
120 -
 121
121 -
 122
122 -
 123
123 -
 124
124 -
 125
125 -
126
-
127
-
128
-
129
-
130
-
131
-
132
-
133
-
134
-
135
-
136
-
137
-
138
-
139
-
140
-
141
-
142
-
143
-
144
-
145
-
146
-
147
-
148
-
149
-
150
-
151
-
152
-
153
-
154
-
155
-
156
-
157
-
158
-
159
-
160
-
161
-
162
-
163
-
164
-
165
-
166
-
167
-
168
-
169
-
170
-
171
-
172
-
173
-
174
-
175
-
176
-
177
-
178
-
179
-
180
-
181
-
182
-
183
-
184
-
185
-
186
-
187
-
188
-
189
-
190
-
191
-
192
-
193
-
194
-
195
-
196
-
197
-
198
-
199
-
200
-
201
-
202
-
203
-
204
-
205
-
206
-
207
-
208
-
209
-
210
-
211
-
212
-
213
-
214
-
215
-
216
-
217
-
218
-
219
-
220
-
221
-
222
-
223
-
224
-
225
-
226
-
227
-
228
-
229
-
230
-
231
-
232
-
233
-
234
-
235
-
236
-
237
-
238
-
239
-
240
-
241
-
242
-
243
-
244
-
245
-
246
-
247
-
248
-
249
-
250
-
251
-
252
-
253
-
254
-
255
-
256
-
257
-
258
-
259
-
260
-
261
-
262
-
263
-
264
-
265
-
266
-
267
-
268
-
269
-
270
-
271
-
272
-
273
-
274
-
275
-
276
-
277
-
278
-
279
-
280
-
281
-
282
-
283
-
284
-
285
-
286
-
287
-
288
-
289
-
290
-
291
-
292
 |
 |

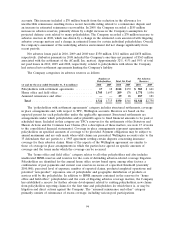
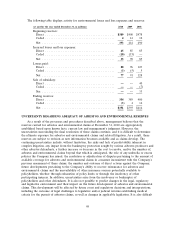
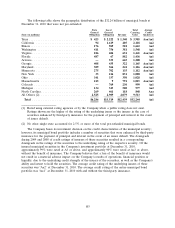
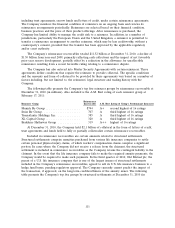
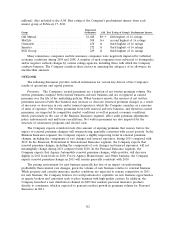
The following table shows the geographic distribution of the $32.24 billion of municipal bonds at
December 31, 2010 that were not pre-refunded.
State Local Total Average
General General Carrying Credit
State (in millions) Obligation Obligation Revenue Value Quality(1)
Texas ................................. $ 423 $ 2,222 $ 1,340 $ 3,985 Aaa/Aa1
California ............................. 94 1,619 405 2,118 Aa2
Illinois ................................ 176 969 518 1,663 Aa2
Washington ............................ 411 756 381 1,548 Aa1
Virginia ............................... 186 604 651 1,441 Aaa/Aa1
Florida ............................... 487 67 882 1,436 Aa1
Arizona ............................... — 535 665 1,200 Aa1
Georgia ............................... 408 435 322 1,165 Aaa/Aa1
Maryland .............................. 309 566 241 1,116 Aaa/Aa1
Minnesota ............................. 275 702 135 1,112 Aaa/Aa1
New York ............................. 33 216 831 1,080 Aa1
Ohio ................................. 341 337 350 1,028 Aa1
Massachusetts .......................... 215 9 791 1,015 Aaa/Aa1
Colorado .............................. — 769 230 999 Aa1
Michigan .............................. 134 343 500 977 Aa2
North Carolina .......................... 269 461 118 848 Aaa
All Others (2) .......................... 2,525 2,909 4,079 9,513 Aa1
Total ............................... $6,286 $13,519 $12,439 $32,244 Aa1
(1) Rated using external rating agencies or by the Company when a public rating does not exist.
Ratings shown are the higher of the rating of the underlying issuer or the insurer in the case of
securities enhanced by third-party insurance for the payment of principal and interest in the event
of issuer default.
(2) No other single state accounted for 2.5% or more of the total pre-refunded municipal bonds.
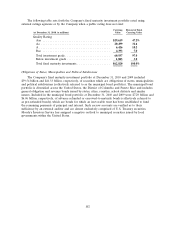
The Company bases its investment decision on the credit characteristics of the municipal security;
however, its municipal bond portfolio includes a number of securities that were enhanced by third-party
insurance for the payment of principal and interest in the event of an issuer default. The downgrade
during 2009 and 2008 of credit ratings of insurers of these securities resulted in a corresponding
downgrade in the ratings of the securities to the underlying rating of the respective security. Of the
insured municipal securities in the Company’s investment portfolio at December 31, 2010,
approximately 99% were rated at A3 or above, and approximately 90% were rated at Aa3 or above,
without the benefit of insurance. The Company believes that a loss of the benefit of insurance would
not result in a material adverse impact on the Company’s results of operations, financial position or
liquidity, due to the underlying credit strength of the issuers of the securities, as well as the Company’s
ability and intent to hold the securities. The average credit rating of the underlying issuers of these
securities was ‘‘Aa2’’ at December 31, 2010. The average credit rating of the entire municipal bond
portfolio was ‘‘Aa1’’ at December 31, 2010 with and without the third-party insurance.
103