Travelers 2010 Annual Report Download - page 91
Download and view the complete annual report
Please find page 91 of the 2010 Travelers annual report below. You can navigate through the pages in the report by either clicking on the pages listed below, or by using the keyword search tool below to find specific information within the annual report.-
 1
1 -
2
-
3
-
4
-
5
-
6
-
7
-
8
-
9
-
10
-
11
-
12
-
13
-
14
-
15
-
16
-
17
-
18
-
19
-
20
-
21
-
22
-
23
-
24
-
25
-
26
-
27
-
28
-
29
-
30
-
31
-
32
-
33
-
34
-
35
-
36
-
37
-
38
-
39
-
40
-
41
-
42
-
43
-
44
-
45
-
46
-
47
-
48
-
49
-
50
-
51
-
52
-
53
-
54
-
55
-
56
-
57
-
58
-
59
-
60
-
61
-
62
-
63
-
64
-
65
-
66
-
67
-
68
-
69
-
70
-
71
-
72
-
73
-
74
-
75
-
76
-
77
-
78
-
79
-
80
-
 81
81 -
 82
82 -
 83
83 -
 84
84 -
 85
85 -
 86
86 -
 87
87 -
 88
88 -
 89
89 -
 90
90 -
 91
91 -
 92
92 -
 93
93 -
 94
94 -
 95
95 -
 96
96 -
 97
97 -
 98
98 -
 99
99 -
 100
100 -
 101
101 -
102
-
103
-
104
-
105
-
106
-
107
-
108
-
109
-
110
-
111
-
112
-
113
-
114
-
115
-
116
-
117
-
118
-
119
-
120
-
121
-
122
-
123
-
124
-
125
-
126
-
127
-
128
-
129
-
130
-
131
-
132
-
133
-
134
-
135
-
136
-
137
-
138
-
139
-
140
-
141
-
142
-
143
-
144
-
145
-
146
-
147
-
148
-
149
-
150
-
151
-
152
-
153
-
154
-
155
-
156
-
157
-
158
-
159
-
160
-
161
-
162
-
163
-
164
-
165
-
166
-
167
-
168
-
169
-
170
-
171
-
172
-
173
-
174
-
175
-
176
-
177
-
178
-
179
-
180
-
181
-
182
-
183
-
184
-
185
-
186
-
187
-
188
-
189
-
190
-
191
-
192
-
193
-
194
-
195
-
196
-
197
-
198
-
199
-
200
-
201
-
202
-
203
-
204
-
205
-
206
-
207
-
208
-
209
-
210
-
211
-
212
-
213
-
214
-
215
-
216
-
217
-
218
-
219
-
220
-
221
-
222
-
223
-
224
-
225
-
226
-
227
-
228
-
229
-
230
-
231
-
232
-
233
-
234
-
235
-
236
-
237
-
238
-
239
-
240
-
241
-
242
-
243
-
244
-
245
-
246
-
247
-
248
-
249
-
250
-
251
-
252
-
253
-
254
-
255
-
256
-
257
-
258
-
259
-
260
-
261
-
262
-
263
-
264
-
265
-
266
-
267
-
268
-
269
-
270
-
271
-
272
-
273
-
274
-
275
-
276
-
277
-
278
-
279
-
280
-
281
-
282
-
283
-
284
-
285
-
286
-
287
-
288
-
289
-
290
-
291
-
292
 |
 |
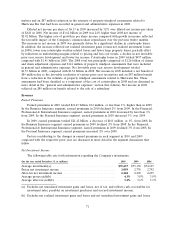
primarily concentrated in the general liability, commercial multi-peril, commercial automobile and
commercial property product lines for recent accident years, reflecting greater reductions in frequency
than the Company expected based upon long-term frequency trends that have been declining. The
general liability and commercial multi-peril product lines experienced better than anticipated loss
development that was attributable to several factors, including what the Company believes to be
improved legal and judicial environments, as well as enhanced risk control, underwriting and claim
process initiatives. The commercial automobile line of business experienced better than expected loss
development that was attributable to what the Company believes to be more favorable legal and
judicial environments, claim handling initiatives and improvements in auto safety technology. The
commercial property product line improvement primarily occurred in the 2007 and 2008 accident years
as a result of better than expected loss development for certain large national property and inland
marine exposures. In addition, the commercial property product line’s 2005 accident year experience
improved due to the litigation environment relating to, and ongoing claim settlements for, Hurricane
Katrina. The net favorable prior year reserve development in these product lines in 2009 was partially
offset by $185 million and $70 million increases to asbestos reserves and environmental reserves,
respectively (discussed in more detail in the ‘‘Asbestos Claims and Litigation’’ and ‘‘Environmental
Claims and Litigation’’ sections herein).
Net favorable prior year development in 2008 was driven by better than expected loss development
primarily concentrated in the general liability and commercial multi-peril product lines, an increase in
anticipated ceded reinsurance recoveries for older accident years in the general liability product line
and better than anticipated loss development in the commercial property and commercial automobile
product lines. The net favorable prior year reserve development in the general liability and commercial
multi-peril lines was attributable to several factors, including improved legal and judicial environments,
as well as enhanced risk control, underwriting and claim process initiatives. The commercial property
product line improvement occurred primarily in the 2007 accident year as a result of better than
expected loss development for certain large national property, national programs, and ocean marine
claim exposures and lower than expected weather-related losses during the last half of 2007, as well as
favorable loss development in certain large inland marine claim exposures and in ceded reinsurance
recoveries for commercial property large claims. In addition, the commercial multi-peril and property
product lines’ 2005 accident year results experienced improvement due to the litigation environment
relating to, and ongoing claim settlements for, Hurricane Katrina. The commercial automobile product
line improvement was attributable to several factors, including improved legal and judicial
environments, as well as enhanced risk control, underwriting and claim process initiatives. The net
favorable prior year reserve development in the foregoing product lines in 2008 was partially offset by
net unfavorable prior year reserve development in the workers’ compensation product line, primarily
driven by higher than anticipated medical costs related to 2004 and prior accident years, and by
$70 million and $85 million increases to asbestos and environmental reserves, respectively (discussed in
more detail in the ‘‘Asbestos Claims and Litigation’’ and ‘‘Environmental Claims and Litigation’’
sections herein).
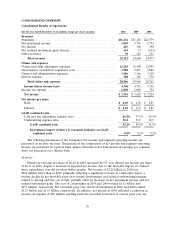
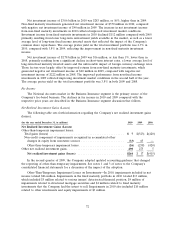
The amortization of deferred acquisition costs totaled $1.75 billion in 2010, $26 million lower than
the comparable total of $1.78 billion in 2009. In 2009, the total of $1.78 billion was $43 million lower
than the 2008 total of $1.82 billion. The declines in both years were consistent with the declines in
earned premiums.
General and administrative expenses in 2010 totaled $1.90 billion, $62 million, or 3%, lower than
in 2009. The 2009 total included a $38 million reduction in the estimate of property windpool
assessments related to Hurricane Ike. Adjusting for that reduction in 2009, general and administrative
expenses in 2010 were $100 million, or 5%, lower than in 2009, driven by a decline in loss-based
assessments that reflected the impact of favorable prior year reserve development and favorable rate
changes, as well as a decline in employee-related expenses and a reduction in the amount of the
79