Travelers 2010 Annual Report Download - page 90
Download and view the complete annual report
Please find page 90 of the 2010 Travelers annual report below. You can navigate through the pages in the report by either clicking on the pages listed below, or by using the keyword search tool below to find specific information within the annual report.-
 1
1 -
2
-
3
-
4
-
5
-
6
-
7
-
8
-
9
-
10
-
11
-
12
-
13
-
14
-
15
-
16
-
17
-
18
-
19
-
20
-
21
-
22
-
23
-
24
-
25
-
26
-
27
-
28
-
29
-
30
-
31
-
32
-
33
-
34
-
35
-
36
-
37
-
38
-
39
-
40
-
41
-
42
-
43
-
44
-
45
-
46
-
47
-
48
-
49
-
50
-
51
-
52
-
53
-
54
-
55
-
56
-
57
-
58
-
59
-
60
-
61
-
62
-
63
-
64
-
65
-
66
-
67
-
68
-
69
-
70
-
71
-
72
-
73
-
74
-
75
-
76
-
77
-
78
-
79
-
 80
80 -
 81
81 -
 82
82 -
 83
83 -
 84
84 -
 85
85 -
 86
86 -
 87
87 -
 88
88 -
 89
89 -
 90
90 -
 91
91 -
 92
92 -
 93
93 -
 94
94 -
 95
95 -
 96
96 -
 97
97 -
 98
98 -
 99
99 -
 100
100 -
101
-
102
-
103
-
104
-
105
-
106
-
107
-
108
-
109
-
110
-
111
-
112
-
113
-
114
-
115
-
116
-
117
-
118
-
119
-
120
-
121
-
122
-
123
-
124
-
125
-
126
-
127
-
128
-
129
-
130
-
131
-
132
-
133
-
134
-
135
-
136
-
137
-
138
-
139
-
140
-
141
-
142
-
143
-
144
-
145
-
146
-
147
-
148
-
149
-
150
-
151
-
152
-
153
-
154
-
155
-
156
-
157
-
158
-
159
-
160
-
161
-
162
-
163
-
164
-
165
-
166
-
167
-
168
-
169
-
170
-
171
-
172
-
173
-
174
-
175
-
176
-
177
-
178
-
179
-
180
-
181
-
182
-
183
-
184
-
185
-
186
-
187
-
188
-
189
-
190
-
191
-
192
-
193
-
194
-
195
-
196
-
197
-
198
-
199
-
200
-
201
-
202
-
203
-
204
-
205
-
206
-
207
-
208
-
209
-
210
-
211
-
212
-
213
-
214
-
215
-
216
-
217
-
218
-
219
-
220
-
221
-
222
-
223
-
224
-
225
-
226
-
227
-
228
-
229
-
230
-
231
-
232
-
233
-
234
-
235
-
236
-
237
-
238
-
239
-
240
-
241
-
242
-
243
-
244
-
245
-
246
-
247
-
248
-
249
-
250
-
251
-
252
-
253
-
254
-
255
-
256
-
257
-
258
-
259
-
260
-
261
-
262
-
263
-
264
-
265
-
266
-
267
-
268
-
269
-
270
-
271
-
272
-
273
-
274
-
275
-
276
-
277
-
278
-
279
-
280
-
281
-
282
-
283
-
284
-
285
-
286
-
287
-
288
-
289
-
290
-
291
-
292
 |
 |
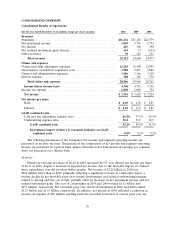
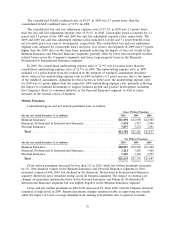
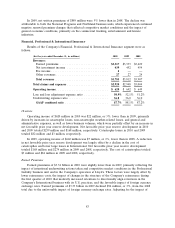
Net Investment Income
Refer to the ‘‘Net Investment Income’’ section of ‘‘Consolidated Results of Operations’’ herein for
a discussion of the changes in the Company’s net investment income in 2010 and 2009 as compared
with the prior year.
Fee Income
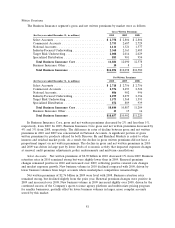
National Accounts is the primary source of fee income due to its service businesses, which include
claim and loss prevention services to large companies that choose to self-insure a portion of their
insurance risks, as well as claims and policy management services to workers’ compensation residual
market pools. The $21 million and $84 million declines, respectively, in fee income in 2010 and 2009
compared with the preceding year primarily reflected lower new business volume due to lower levels of
economic activity and lower serviced premium and claim volume due to the de-population of workers’
compensation residual market pools. The declines in both years also reflected the impact of both lower
claim volume and lower loss costs (as fees are based either on the number of claims serviced or as a
percentage of losses) driven by workers’ compensation reforms, as well as overall lower claim frequency
and increased competition.
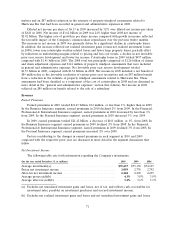
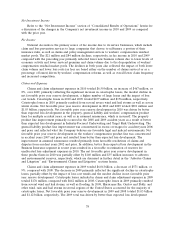
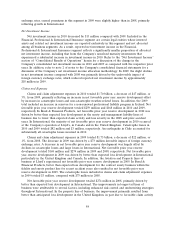
Claims and Expenses
Claims and claim adjustment expenses in 2010 totaled $6.50 billion, an increase of $467 million, or
8%, over 2009, primarily reflecting the significant increase in catastrophe losses, the modest decline in
net favorable prior year reserve development, a higher number of large losses and the impact of loss
cost trends. Catastrophe losses in 2010 and 2009 totaled $437 million and $176 million, respectively.
Catastrophe losses in 2010 primarily resulted from several severe wind and hail storms as well as severe
winter storms. Net favorable prior year reserve development in 2010 and 2009 totaled $901 million and
$1.03 billion, respectively. Net favorable prior year reserve development in 2010 was driven by better
than expected loss development in the property, general liability and workers’ compensation product
lines for multiple accident years, as well as in assumed reinsurance, which is in runoff. The property
product line improvement primarily occurred in the 2008 and 2009 accident years as a result of better
than expected loss development in Industry-Focused Underwriting and Target Risk Underwriting. The
general liability product line improvement was concentrated in excess coverages for accident years 2006
and prior and reflected what the Company believes are favorable legal and judicial environments. Net
favorable prior year reserve development in the workers’ compensation product line was concentrated
in accident years 2007 and prior and resulted from better than expected loss development. The
improvement in assumed reinsurance resulted primarily from favorable resolutions of claims and
disputes from accident years 2002 and prior. In addition, better than expected loss development in the
Business Insurance segment in recent years resulted in a favorable re-estimation of reserves for
unallocated loss adjustment expenses in 2010. The net favorable prior year reserve development in
these product lines in 2010 was partially offset by $140 million and $35 million increases to asbestos
and environmental reserves, respectively, which are discussed in further detail in the ‘‘Asbestos Claims
and Litigation’’ and ‘‘Environmental Claims and Litigation’’ sections herein.
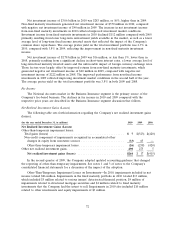
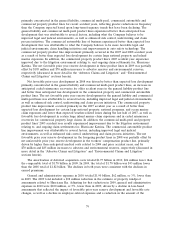
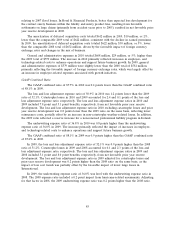
Claims and claim adjustment expenses in 2009 totaled $6.04 billion, a decrease of $571 million, or
9%, compared with 2008. The decrease in 2009 primarily reflected the significant decline in catastrophe
losses, partially offset by the impact of loss cost trends and the modest decline in net favorable prior
year reserve development. Catastrophe losses included in claims and claim adjustment expenses in 2009
totaled $176 million, compared with $642 million in 2008. Catastrophe losses in 2009 primarily resulted
from several wind and hail storms, as well as flooding. In 2008, Hurricanes Ike, Gustav and Dolly, and
other wind, rain and hail storms in several regions of the United States accounted for the majority of
catastrophe losses. Net favorable prior year reserve development in 2009 and 2008 totaled $1.03 billion
and $1.12 billion, respectively. The 2009 total was driven by better than expected loss development
78