Travelers 2010 Annual Report Download - page 185
Download and view the complete annual report
Please find page 185 of the 2010 Travelers annual report below. You can navigate through the pages in the report by either clicking on the pages listed below, or by using the keyword search tool below to find specific information within the annual report.-
 1
1 -
2
-
3
-
4
-
5
-
6
-
7
-
8
-
9
-
10
-
11
-
12
-
13
-
14
-
15
-
16
-
17
-
18
-
19
-
20
-
21
-
22
-
23
-
24
-
25
-
26
-
27
-
28
-
29
-
30
-
31
-
32
-
33
-
34
-
35
-
36
-
37
-
38
-
39
-
40
-
41
-
42
-
43
-
44
-
45
-
46
-
47
-
48
-
49
-
50
-
51
-
52
-
53
-
54
-
55
-
56
-
57
-
58
-
59
-
60
-
61
-
62
-
63
-
64
-
65
-
66
-
67
-
68
-
69
-
70
-
71
-
72
-
73
-
74
-
75
-
76
-
77
-
78
-
79
-
80
-
81
-
82
-
83
-
84
-
85
-
86
-
87
-
88
-
89
-
90
-
91
-
92
-
93
-
94
-
95
-
96
-
97
-
98
-
99
-
100
-
101
-
102
-
103
-
104
-
105
-
106
-
107
-
108
-
109
-
110
-
111
-
112
-
113
-
114
-
115
-
116
-
117
-
118
-
119
-
120
-
121
-
122
-
123
-
124
-
125
-
126
-
127
-
128
-
129
-
130
-
131
-
132
-
133
-
134
-
135
-
136
-
137
-
138
-
139
-
140
-
141
-
142
-
143
-
144
-
145
-
146
-
147
-
148
-
149
-
150
-
151
-
152
-
153
-
154
-
155
-
156
-
157
-
158
-
159
-
160
-
161
-
162
-
163
-
164
-
165
-
166
-
167
-
168
-
169
-
170
-
171
-
172
-
173
-
174
-
 175
175 -
 176
176 -
 177
177 -
 178
178 -
 179
179 -
 180
180 -
 181
181 -
 182
182 -
 183
183 -
 184
184 -
 185
185 -
 186
186 -
 187
187 -
 188
188 -
 189
189 -
 190
190 -
 191
191 -
 192
192 -
 193
193 -
 194
194 -
 195
195 -
196
-
197
-
198
-
199
-
200
-
201
-
202
-
203
-
204
-
205
-
206
-
207
-
208
-
209
-
210
-
211
-
212
-
213
-
214
-
215
-
216
-
217
-
218
-
219
-
220
-
221
-
222
-
223
-
224
-
225
-
226
-
227
-
228
-
229
-
230
-
231
-
232
-
233
-
234
-
235
-
236
-
237
-
238
-
239
-
240
-
241
-
242
-
243
-
244
-
245
-
246
-
247
-
248
-
249
-
250
-
251
-
252
-
253
-
254
-
255
-
256
-
257
-
258
-
259
-
260
-
261
-
262
-
263
-
264
-
265
-
266
-
267
-
268
-
269
-
270
-
271
-
272
-
273
-
274
-
275
-
276
-
277
-
278
-
279
-
280
-
281
-
282
-
283
-
284
-
285
-
286
-
287
-
288
-
289
-
290
-
291
-
292
 |
 |

THE TRAVELERS COMPANIES, INC. AND SUBSIDIARIES
NOTES TO CONSOLIDATED FINANCIAL STATEMENTS (Continued)
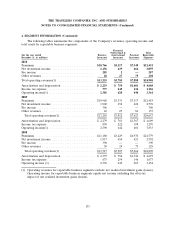
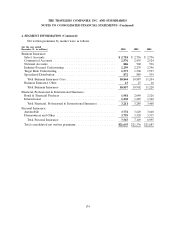
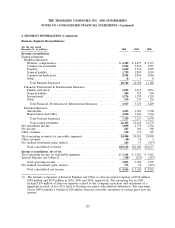
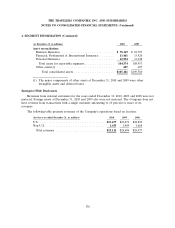
2. SEGMENT INFORMATION (Continued)
The following tables summarize the components of the Company’s revenues, operating income and
total assets by reportable business segments:
Financial,
Professional & Total
(for the year ended Business International Personal Reportable
December 31, in millions) Insurance Insurance Insurance Segments
2010
Premiums .................................. $10,766 $3,317 $7,349 $21,432
Net investment income ........................ 2,156 439 464 3,059
Fee income ................................. 285 2 — 287
Other revenues .............................. 28 27 75 130
Total operating revenues(1) ..................... $13,235 $3,785 $7,888 $24,908
Amortization and depreciation ................... $ 2,253 $ 754 $1,601 $ 4,608
Income tax expense ........................... 777 245 134 1,156
Operating income(1) .......................... 2,301 620 440 3,361
2009
Premiums .................................. $10,968 $3,333 $7,117 $21,418
Net investment income ........................ 1,902 452 422 2,776
Fee income ................................. 306 — — 306
Other revenues .............................. 42 27 84 153
Total operating revenues(1) .................... $13,218 $3,812 $7,623 $24,653
Amortization and depreciation ................... $ 2,279 $ 763 $1,567 $ 4,609
Income tax expense ........................... 850 222 198 1,270
Operating income(1) .......................... 2,590 642 601 3,833
2008
Premiums .................................. $11,180 $3,429 $6,970 $21,579
Net investment income ........................ 1,917 454 421 2,792
Fee income ................................. 390 — — 390
Other revenues .............................. 30 24 75 129
Total operating revenues(1) .................... $13,517 $3,907 $7,466 $24,890
Amortization and depreciation ................... $ 2,357 $ 796 $1,544 $ 4,697
Income tax expense ........................... 673 254 146 1,073
Operating income (1) ......................... 2,338 649 465 3,452
(1) Operating revenues for reportable business segments exclude net realized investment gains (losses).
Operating income for reportable business segments equals net income excluding the after-tax
impact of net realized investment gains (losses).
173