Travelers 2010 Annual Report Download - page 197
Download and view the complete annual report
Please find page 197 of the 2010 Travelers annual report below. You can navigate through the pages in the report by either clicking on the pages listed below, or by using the keyword search tool below to find specific information within the annual report.-
 1
1 -
2
-
3
-
4
-
5
-
6
-
7
-
8
-
9
-
10
-
11
-
12
-
13
-
14
-
15
-
16
-
17
-
18
-
19
-
20
-
21
-
22
-
23
-
24
-
25
-
26
-
27
-
28
-
29
-
30
-
31
-
32
-
33
-
34
-
35
-
36
-
37
-
38
-
39
-
40
-
41
-
42
-
43
-
44
-
45
-
46
-
47
-
48
-
49
-
50
-
51
-
52
-
53
-
54
-
55
-
56
-
57
-
58
-
59
-
60
-
61
-
62
-
63
-
64
-
65
-
66
-
67
-
68
-
69
-
70
-
71
-
72
-
73
-
74
-
75
-
76
-
77
-
78
-
79
-
80
-
81
-
82
-
83
-
84
-
85
-
86
-
87
-
88
-
89
-
90
-
91
-
92
-
93
-
94
-
95
-
96
-
97
-
98
-
99
-
100
-
101
-
102
-
103
-
104
-
105
-
106
-
107
-
108
-
109
-
110
-
111
-
112
-
113
-
114
-
115
-
116
-
117
-
118
-
119
-
120
-
121
-
122
-
123
-
124
-
125
-
126
-
127
-
128
-
129
-
130
-
131
-
132
-
133
-
134
-
135
-
136
-
137
-
138
-
139
-
140
-
141
-
142
-
143
-
144
-
145
-
146
-
147
-
148
-
149
-
150
-
151
-
152
-
153
-
154
-
155
-
156
-
157
-
158
-
159
-
160
-
161
-
162
-
163
-
164
-
165
-
166
-
167
-
168
-
169
-
170
-
171
-
172
-
173
-
174
-
175
-
176
-
177
-
178
-
179
-
180
-
181
-
182
-
183
-
184
-
185
-
186
-
 187
187 -
 188
188 -
 189
189 -
 190
190 -
 191
191 -
 192
192 -
 193
193 -
 194
194 -
 195
195 -
 196
196 -
 197
197 -
 198
198 -
 199
199 -
 200
200 -
 201
201 -
 202
202 -
 203
203 -
 204
204 -
 205
205 -
 206
206 -
 207
207 -
208
-
209
-
210
-
211
-
212
-
213
-
214
-
215
-
216
-
217
-
218
-
219
-
220
-
221
-
222
-
223
-
224
-
225
-
226
-
227
-
228
-
229
-
230
-
231
-
232
-
233
-
234
-
235
-
236
-
237
-
238
-
239
-
240
-
241
-
242
-
243
-
244
-
245
-
246
-
247
-
248
-
249
-
250
-
251
-
252
-
253
-
254
-
255
-
256
-
257
-
258
-
259
-
260
-
261
-
262
-
263
-
264
-
265
-
266
-
267
-
268
-
269
-
270
-
271
-
272
-
273
-
274
-
275
-
276
-
277
-
278
-
279
-
280
-
281
-
282
-
283
-
284
-
285
-
286
-
287
-
288
-
289
-
290
-
291
-
292
 |
 |

THE TRAVELERS COMPANIES, INC. AND SUBSIDIARIES
NOTES TO CONSOLIDATED FINANCIAL STATEMENTS (Continued)
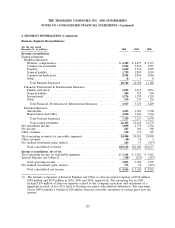
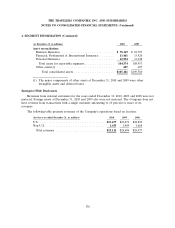
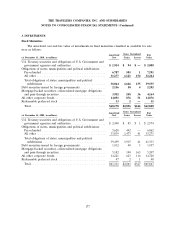
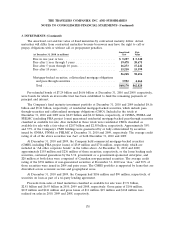
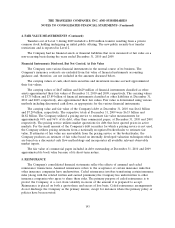
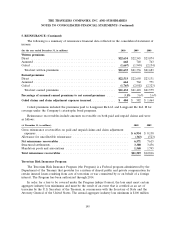
3. INVESTMENTS (Continued)
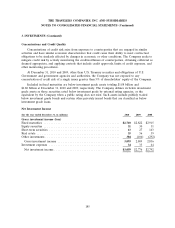
Concentrations and Credit Quality
Concentrations of credit risk arise from exposure to counterparties that are engaged in similar
activities and have similar economic characteristics that could cause their ability to meet contractual
obligations to be similarly affected by changes in economic or other conditions. The Company seeks to
mitigate credit risk by actively monitoring the creditworthiness of counterparties, obtaining collateral as
deemed appropriate, and applying controls that include credit approvals, limits of credit exposure, and
other monitoring procedures.
At December 31, 2010 and 2009, other than U.S. Treasury securities and obligations of U.S.
Government and government agencies and authorities, the Company was not exposed to any
concentration of credit risk of a single issuer greater than 5% of shareholders’ equity of the Company.
Included in fixed maturities are below investment grade assets totaling $1.88 billion and
$1.80 billion at December 31, 2010 and 2009, respectively. The Company defines its below investment
grade assets as those securities rated below investment grade by external rating agencies, or the
equivalent by the Company when a public rating does not exist. Such assets include publicly traded
below investment grade bonds and certain other privately issued bonds that are classified as below
investment grade loans.
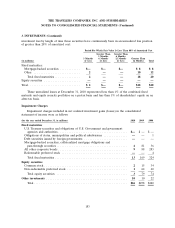
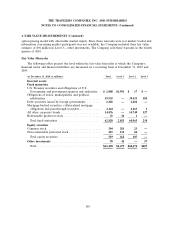
Net Investment Income
(for the year ended December 31, in millions) 2010 2009 2008
Gross investment income (loss)
Fixed maturities ............................................ $2,710 $2,822 $2,915
Equity securities ............................................ 31 30 31
Short-term securities ......................................... 13 27 143
Real estate ................................................ 35 36 39
Other investments ........................................... 304 (106) (292)
Gross investment income .................................... 3,093 2,809 2,836
Investment expenses ......................................... 34 33 44
Net investment income ...................................... $3,059 $2,776 $2,792
185