Travelers 2010 Annual Report Download - page 116
Download and view the complete annual report
Please find page 116 of the 2010 Travelers annual report below. You can navigate through the pages in the report by either clicking on the pages listed below, or by using the keyword search tool below to find specific information within the annual report.-
 1
1 -
2
-
3
-
4
-
5
-
6
-
7
-
8
-
9
-
10
-
11
-
12
-
13
-
14
-
15
-
16
-
17
-
18
-
19
-
20
-
21
-
22
-
23
-
24
-
25
-
26
-
27
-
28
-
29
-
30
-
31
-
32
-
33
-
34
-
35
-
36
-
37
-
38
-
39
-
40
-
41
-
42
-
43
-
44
-
45
-
46
-
47
-
48
-
49
-
50
-
51
-
52
-
53
-
54
-
55
-
56
-
57
-
58
-
59
-
60
-
61
-
62
-
63
-
64
-
65
-
66
-
67
-
68
-
69
-
70
-
71
-
72
-
73
-
74
-
75
-
76
-
77
-
78
-
79
-
80
-
81
-
82
-
83
-
84
-
85
-
86
-
87
-
88
-
89
-
90
-
91
-
92
-
93
-
94
-
95
-
96
-
97
-
98
-
99
-
100
-
101
-
102
-
103
-
104
-
105
-
 106
106 -
 107
107 -
 108
108 -
 109
109 -
 110
110 -
 111
111 -
 112
112 -
 113
113 -
 114
114 -
 115
115 -
 116
116 -
 117
117 -
 118
118 -
 119
119 -
 120
120 -
 121
121 -
 122
122 -
 123
123 -
 124
124 -
 125
125 -
 126
126 -
127
-
128
-
129
-
130
-
131
-
132
-
133
-
134
-
135
-
136
-
137
-
138
-
139
-
140
-
141
-
142
-
143
-
144
-
145
-
146
-
147
-
148
-
149
-
150
-
151
-
152
-
153
-
154
-
155
-
156
-
157
-
158
-
159
-
160
-
161
-
162
-
163
-
164
-
165
-
166
-
167
-
168
-
169
-
170
-
171
-
172
-
173
-
174
-
175
-
176
-
177
-
178
-
179
-
180
-
181
-
182
-
183
-
184
-
185
-
186
-
187
-
188
-
189
-
190
-
191
-
192
-
193
-
194
-
195
-
196
-
197
-
198
-
199
-
200
-
201
-
202
-
203
-
204
-
205
-
206
-
207
-
208
-
209
-
210
-
211
-
212
-
213
-
214
-
215
-
216
-
217
-
218
-
219
-
220
-
221
-
222
-
223
-
224
-
225
-
226
-
227
-
228
-
229
-
230
-
231
-
232
-
233
-
234
-
235
-
236
-
237
-
238
-
239
-
240
-
241
-
242
-
243
-
244
-
245
-
246
-
247
-
248
-
249
-
250
-
251
-
252
-
253
-
254
-
255
-
256
-
257
-
258
-
259
-
260
-
261
-
262
-
263
-
264
-
265
-
266
-
267
-
268
-
269
-
270
-
271
-
272
-
273
-
274
-
275
-
276
-
277
-
278
-
279
-
280
-
281
-
282
-
283
-
284
-
285
-
286
-
287
-
288
-
289
-
290
-
291
-
292
 |
 |

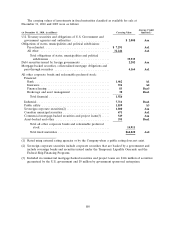
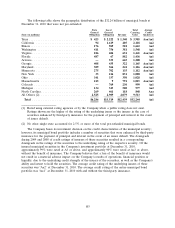
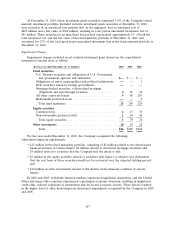
Debt Securities Issued by Foreign Governments
The following table shows the geographic distribution of the Company’s investments in debt
securities issued by foreign governments at December 31, 2010.
Carrying Average Credit
(at December 31, 2010, in millions) Value Quality(1)
Foreign Government:
Canada ...................................... $ 894 Aaa
United Kingdom ............................... 890 Aaa
Germany .................................... 159 Aaa
Australia .................................... 134 Aaa
All Others ................................... 125 Aa2
Total ...................................... $2,202 Aaa
(1) Rated using external rating agencies or by the Company when a public rating does not
exist.
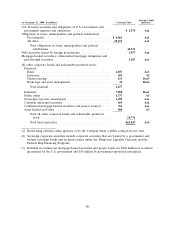
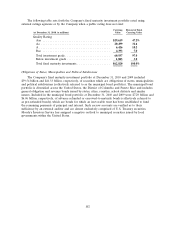
Mortgage-Backed Securities, Collateralized Mortgage Obligations and Pass-Through Securities
The Company’s fixed maturity investment portfolio at December 31, 2010 and 2009 included
$4.16 billion and $5.21 billion, respectively, of residential mortgage-backed securities including
pass-through-securities and collateralized mortgage obligations (CMO), all of which are subject to
prepayment risk (either shortening or lengthening of duration). While prepayment risk for both
guaranteed and non-guaranteed securities and its effect on income cannot be fully controlled,
particularly when interest rates move dramatically, the Company’s investment strategy generally favors
securities that control this risk within expected interest rate ranges. Included in the totals at
December 31, 2010 and 2009 were $2.09 billion and $2.63 billion, respectively, of GNMA, FNMA and
FHLMC (excluding FHA project loans) guaranteed residential mortgage-backed pass-through securities
classified as available for sale. Also included in those totals were residential CMOs classified as
available for sale with a fair value of $2.07 billion and $2.58 billion, respectively. Approximately 38%
and 37% of the Company’s CMO holdings were guaranteed by or fully collateralized by securities
issued by GNMA, FNMA or FHLMC at December 31, 2010 and 2009, respectively. The average credit
rating of all of the above securities was ‘‘Aa1’’ at both December 31, 2010 and 2009.
The Company makes investments in residential CMOs that are either guaranteed by GNMA,
FNMA or FHLMC, or if not guaranteed, are senior or super-senior positions within their respective
securitizations. Both guaranteed and non-guaranteed residential CMOs allocate the distribution of
payments from the underlying mortgages among different classes of bondholders. In addition,
non-guaranteed residential CMOs provide structures that allocate the impact of credit losses to
different classes of bondholders. Senior and super-senior CMOs are protected, to varying degrees, from
credit losses as those losses are initially allocated to subordinated bondholders. The Company’s
investment strategy is to purchase CMO tranches that are expected to offer the most favorable return
given the Company’s assessment of associated risks. The Company does not purchase residual interests
in CMOs.
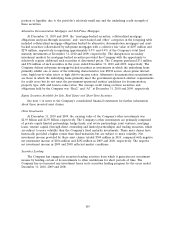
Commercial Mortgage-Backed Securities and Project Loans
At December 31, 2010 and 2009, the Company held commercial mortgage-backed securities
(including FHA project loans) of $549 million and $714 million, respectively. The Company does not
believe this portfolio exposes it to a material adverse impact on its results of operations, financial
104