Travelers 2010 Annual Report Download - page 119
Download and view the complete annual report
Please find page 119 of the 2010 Travelers annual report below. You can navigate through the pages in the report by either clicking on the pages listed below, or by using the keyword search tool below to find specific information within the annual report.-
 1
1 -
2
-
3
-
4
-
5
-
6
-
7
-
8
-
9
-
10
-
11
-
12
-
13
-
14
-
15
-
16
-
17
-
18
-
19
-
20
-
21
-
22
-
23
-
24
-
25
-
26
-
27
-
28
-
29
-
30
-
31
-
32
-
33
-
34
-
35
-
36
-
37
-
38
-
39
-
40
-
41
-
42
-
43
-
44
-
45
-
46
-
47
-
48
-
49
-
50
-
51
-
52
-
53
-
54
-
55
-
56
-
57
-
58
-
59
-
60
-
61
-
62
-
63
-
64
-
65
-
66
-
67
-
68
-
69
-
70
-
71
-
72
-
73
-
74
-
75
-
76
-
77
-
78
-
79
-
80
-
81
-
82
-
83
-
84
-
85
-
86
-
87
-
88
-
89
-
90
-
91
-
92
-
93
-
94
-
95
-
96
-
97
-
98
-
99
-
100
-
101
-
102
-
103
-
104
-
105
-
106
-
107
-
108
-
 109
109 -
 110
110 -
 111
111 -
 112
112 -
 113
113 -
 114
114 -
 115
115 -
 116
116 -
 117
117 -
 118
118 -
 119
119 -
 120
120 -
 121
121 -
 122
122 -
 123
123 -
 124
124 -
 125
125 -
 126
126 -
 127
127 -
 128
128 -
 129
129 -
130
-
131
-
132
-
133
-
134
-
135
-
136
-
137
-
138
-
139
-
140
-
141
-
142
-
143
-
144
-
145
-
146
-
147
-
148
-
149
-
150
-
151
-
152
-
153
-
154
-
155
-
156
-
157
-
158
-
159
-
160
-
161
-
162
-
163
-
164
-
165
-
166
-
167
-
168
-
169
-
170
-
171
-
172
-
173
-
174
-
175
-
176
-
177
-
178
-
179
-
180
-
181
-
182
-
183
-
184
-
185
-
186
-
187
-
188
-
189
-
190
-
191
-
192
-
193
-
194
-
195
-
196
-
197
-
198
-
199
-
200
-
201
-
202
-
203
-
204
-
205
-
206
-
207
-
208
-
209
-
210
-
211
-
212
-
213
-
214
-
215
-
216
-
217
-
218
-
219
-
220
-
221
-
222
-
223
-
224
-
225
-
226
-
227
-
228
-
229
-
230
-
231
-
232
-
233
-
234
-
235
-
236
-
237
-
238
-
239
-
240
-
241
-
242
-
243
-
244
-
245
-
246
-
247
-
248
-
249
-
250
-
251
-
252
-
253
-
254
-
255
-
256
-
257
-
258
-
259
-
260
-
261
-
262
-
263
-
264
-
265
-
266
-
267
-
268
-
269
-
270
-
271
-
272
-
273
-
274
-
275
-
276
-
277
-
278
-
279
-
280
-
281
-
282
-
283
-
284
-
285
-
286
-
287
-
288
-
289
-
290
-
291
-
292
 |
 |

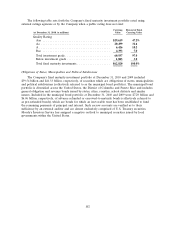
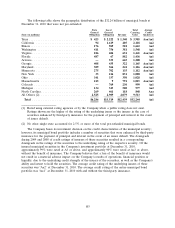
At December 31, 2010, below investment grade securities comprised 3.0% of the Company’s fixed
maturity investment portfolio. Included in below investment grade securities at December 31, 2010
were securities in an unrealized loss position that, in the aggregate, had an amortized cost of
$605 million and a fair value of $564 million, resulting in a net pretax unrealized investment loss of
$41 million. These securities in an unrealized loss position represented approximately 1% of both the
total amortized cost and the fair value of the fixed maturity portfolio at December 31, 2010 and
accounted for 17% of the total gross pretax unrealized investment loss in the fixed maturity portfolio at
December 31, 2010.
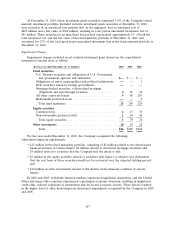
Impairment Charges
Impairment charges included in net realized investment gains (losses) in the consolidated
statement of income were as follows:
(for the year ended December 31, in millions) 2010 2009 2008
Fixed maturities
U.S. Treasury securities and obligations of U.S. Government
and government agencies and authorities .............. $— $— $—
Obligations of states, municipalities and political subdivisions . ——1
Debt securities issued by foreign governments ............ ———
Mortgage-backed securities, collateralized mortgage
obligations and pass-through securities ................ 481 36
All other corporate bonds ........................... 988 283
Redeemable preferred stock ......................... ——4
Total fixed maturities ............................ 13 169 324
Equity securities
Common stock ................................... 215 34
Non-redeemable preferred stock ...................... 164 40
Total equity securities ............................ 379 74
Other investments .................................. 10 10 22
Total ........................................ $26 $258 $420
For the year ended December 31, 2010, the Company recognized the following
other-than-temporary impairments:
• $13 million in the fixed maturities portfolio, consisting of $5 million related to the deteriorated
financial position of various issuers, $4 million related to structured mortgage securities and
$4 million related to securities that the Company had the intent to sell;
• $3 million in the equity portfolio related to securities with respect to which it was determined
that the cost basis of those securities would not be recovered over the expected holding period;
and
• $10 million in other investments related to the decline in the financial condition of various
issuers.
In 2008 and 2009, worldwide financial markets experienced significant disruptions, and the United
States and many other countries experienced a prolonged economic downturn, resulting in heightened
credit risks, reduced valuations of investments and decreased economic activity. Those factors resulted
in the higher level of other-than-temporary investment impairments recognized by the Company in 2008
and 2009.
107