Travelers 2010 Annual Report Download - page 198
Download and view the complete annual report
Please find page 198 of the 2010 Travelers annual report below. You can navigate through the pages in the report by either clicking on the pages listed below, or by using the keyword search tool below to find specific information within the annual report.-
 1
1 -
2
-
3
-
4
-
5
-
6
-
7
-
8
-
9
-
10
-
11
-
12
-
13
-
14
-
15
-
16
-
17
-
18
-
19
-
20
-
21
-
22
-
23
-
24
-
25
-
26
-
27
-
28
-
29
-
30
-
31
-
32
-
33
-
34
-
35
-
36
-
37
-
38
-
39
-
40
-
41
-
42
-
43
-
44
-
45
-
46
-
47
-
48
-
49
-
50
-
51
-
52
-
53
-
54
-
55
-
56
-
57
-
58
-
59
-
60
-
61
-
62
-
63
-
64
-
65
-
66
-
67
-
68
-
69
-
70
-
71
-
72
-
73
-
74
-
75
-
76
-
77
-
78
-
79
-
80
-
81
-
82
-
83
-
84
-
85
-
86
-
87
-
88
-
89
-
90
-
91
-
92
-
93
-
94
-
95
-
96
-
97
-
98
-
99
-
100
-
101
-
102
-
103
-
104
-
105
-
106
-
107
-
108
-
109
-
110
-
111
-
112
-
113
-
114
-
115
-
116
-
117
-
118
-
119
-
120
-
121
-
122
-
123
-
124
-
125
-
126
-
127
-
128
-
129
-
130
-
131
-
132
-
133
-
134
-
135
-
136
-
137
-
138
-
139
-
140
-
141
-
142
-
143
-
144
-
145
-
146
-
147
-
148
-
149
-
150
-
151
-
152
-
153
-
154
-
155
-
156
-
157
-
158
-
159
-
160
-
161
-
162
-
163
-
164
-
165
-
166
-
167
-
168
-
169
-
170
-
171
-
172
-
173
-
174
-
175
-
176
-
177
-
178
-
179
-
180
-
181
-
182
-
183
-
184
-
185
-
186
-
187
-
 188
188 -
 189
189 -
 190
190 -
 191
191 -
 192
192 -
 193
193 -
 194
194 -
 195
195 -
 196
196 -
 197
197 -
 198
198 -
 199
199 -
 200
200 -
 201
201 -
 202
202 -
 203
203 -
 204
204 -
 205
205 -
 206
206 -
 207
207 -
 208
208 -
209
-
210
-
211
-
212
-
213
-
214
-
215
-
216
-
217
-
218
-
219
-
220
-
221
-
222
-
223
-
224
-
225
-
226
-
227
-
228
-
229
-
230
-
231
-
232
-
233
-
234
-
235
-
236
-
237
-
238
-
239
-
240
-
241
-
242
-
243
-
244
-
245
-
246
-
247
-
248
-
249
-
250
-
251
-
252
-
253
-
254
-
255
-
256
-
257
-
258
-
259
-
260
-
261
-
262
-
263
-
264
-
265
-
266
-
267
-
268
-
269
-
270
-
271
-
272
-
273
-
274
-
275
-
276
-
277
-
278
-
279
-
280
-
281
-
282
-
283
-
284
-
285
-
286
-
287
-
288
-
289
-
290
-
291
-
292
 |
 |

THE TRAVELERS COMPANIES, INC. AND SUBSIDIARIES
NOTES TO CONSOLIDATED FINANCIAL STATEMENTS (Continued)
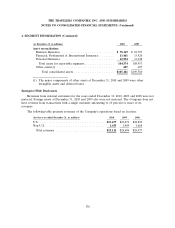
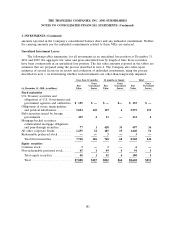
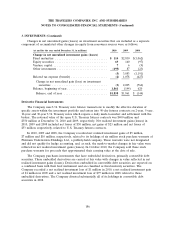
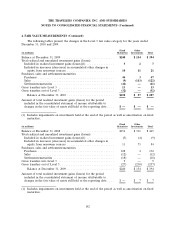
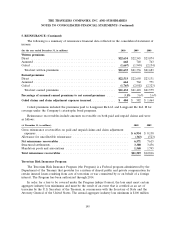
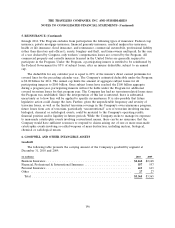
3. INVESTMENTS (Continued)
Changes in net unrealized gains (losses) on investment securities that are included as a separate
component of accumulated other changes in equity from nonowner sources were as follows:
(at and for the year ended December 31, in millions) 2010 2009 2008
Change in net unrealized investment gains (losses)
Fixed maturities .............................. $ 114 $2,830 $(1,062)
Equity securities .............................. 69 160 (97)
Venture capital ............................... 76(9)
Other investments ............................. (195) 87 (23)
(5) 3,083 (1,191)
Related tax expense (benefit) ..................... (2) 1,078 (427)
Change in net unrealized gain (loss) on investment
securities ................................ (3) 2,005 (764)
Balance, beginning of year ....................... 1,861 (144) 620
Balance, end of year ......................... $1,858 $1,861 $ (144)
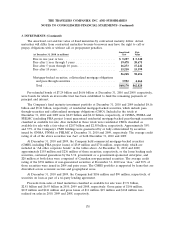
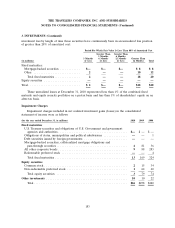
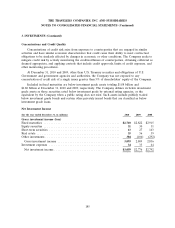
Derivative Financial Instruments
The Company uses U.S. Treasury note futures transactions to modify the effective duration of
specific assets within the investment portfolio and enters into 90-day futures contracts on 2-year, 5-year,
10-year and 30-year U.S. Treasury notes which require a daily mark-to-market and settlement with the
broker. The notional value of the open U.S. Treasury futures contracts was $400 million and
$350 million at December 31, 2010 and 2009, respectively. Net realized investment gains (losses) in
2010, 2009 and 2008 included net losses of $30 million, net gains of $23 million and net losses of
$53 million, respectively, related to U.S. Treasury futures contracts.
In 2010, 2009 and 2008, the Company recorded net realized investment gains of $5 million,
$7 million and $10 million, respectively, related to its holdings of six million stock purchase warrants of
Platinum Underwriters Holdings, Ltd., a publicly-held company. These warrants were not designated
and did not qualify for hedge accounting, and, as such, the mark-to-market changes in fair value were
reflected in net realized investment gains (losses). In October 2010, the Company sold these stock
purchase warrants for proceeds that approximated their carrying value at the date of sale.
The Company purchases investments that have embedded derivatives, primarily convertible debt
securities. These embedded derivatives are carried at fair value with changes in value reflected in net
realized investment gains (losses). Derivatives embedded in convertible debt securities are reported on
a combined basis with their host instrument and are classified as fixed maturity securities. The
Company recorded a net realized investment loss of $1 million in 2010, a net realized investment gain
of $1 million in 2009 and a net realized investment loss of $77 million in 2008 related to these
embedded derivatives. The Company divested substantially all of its holdings in convertible debt
securities in 2008.
186