Travelers 2010 Annual Report Download - page 118
Download and view the complete annual report
Please find page 118 of the 2010 Travelers annual report below. You can navigate through the pages in the report by either clicking on the pages listed below, or by using the keyword search tool below to find specific information within the annual report.-
 1
1 -
2
-
3
-
4
-
5
-
6
-
7
-
8
-
9
-
10
-
11
-
12
-
13
-
14
-
15
-
16
-
17
-
18
-
19
-
20
-
21
-
22
-
23
-
24
-
25
-
26
-
27
-
28
-
29
-
30
-
31
-
32
-
33
-
34
-
35
-
36
-
37
-
38
-
39
-
40
-
41
-
42
-
43
-
44
-
45
-
46
-
47
-
48
-
49
-
50
-
51
-
52
-
53
-
54
-
55
-
56
-
57
-
58
-
59
-
60
-
61
-
62
-
63
-
64
-
65
-
66
-
67
-
68
-
69
-
70
-
71
-
72
-
73
-
74
-
75
-
76
-
77
-
78
-
79
-
80
-
81
-
82
-
83
-
84
-
85
-
86
-
87
-
88
-
89
-
90
-
91
-
92
-
93
-
94
-
95
-
96
-
97
-
98
-
99
-
100
-
101
-
102
-
103
-
104
-
105
-
106
-
107
-
 108
108 -
 109
109 -
 110
110 -
 111
111 -
 112
112 -
 113
113 -
 114
114 -
 115
115 -
 116
116 -
 117
117 -
 118
118 -
 119
119 -
 120
120 -
 121
121 -
 122
122 -
 123
123 -
 124
124 -
 125
125 -
 126
126 -
 127
127 -
 128
128 -
129
-
130
-
131
-
132
-
133
-
134
-
135
-
136
-
137
-
138
-
139
-
140
-
141
-
142
-
143
-
144
-
145
-
146
-
147
-
148
-
149
-
150
-
151
-
152
-
153
-
154
-
155
-
156
-
157
-
158
-
159
-
160
-
161
-
162
-
163
-
164
-
165
-
166
-
167
-
168
-
169
-
170
-
171
-
172
-
173
-
174
-
175
-
176
-
177
-
178
-
179
-
180
-
181
-
182
-
183
-
184
-
185
-
186
-
187
-
188
-
189
-
190
-
191
-
192
-
193
-
194
-
195
-
196
-
197
-
198
-
199
-
200
-
201
-
202
-
203
-
204
-
205
-
206
-
207
-
208
-
209
-
210
-
211
-
212
-
213
-
214
-
215
-
216
-
217
-
218
-
219
-
220
-
221
-
222
-
223
-
224
-
225
-
226
-
227
-
228
-
229
-
230
-
231
-
232
-
233
-
234
-
235
-
236
-
237
-
238
-
239
-
240
-
241
-
242
-
243
-
244
-
245
-
246
-
247
-
248
-
249
-
250
-
251
-
252
-
253
-
254
-
255
-
256
-
257
-
258
-
259
-
260
-
261
-
262
-
263
-
264
-
265
-
266
-
267
-
268
-
269
-
270
-
271
-
272
-
273
-
274
-
275
-
276
-
277
-
278
-
279
-
280
-
281
-
282
-
283
-
284
-
285
-
286
-
287
-
288
-
289
-
290
-
291
-
292
 |
 |

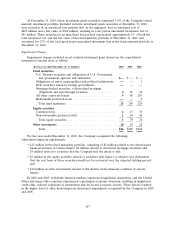
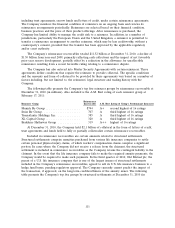
Net Unrealized Investment Gains (Losses)
The net unrealized investment gains (losses) that were included as a separate component of
accumulated other changes in equity from nonowner sources were as follows:
(at December 31, in millions) 2010 2009 2008
Fixed maturities ................................ $2,650 $2,536 $(294)
Equity securities ............................... 147 78 (82)
Other investments .............................. 28 216 123
Unrealized investment gains (losses) before tax ....... 2,825 2,830 (253)
Tax expense (benefit) ............................ 967 969 (109)
Net unrealized investment gains (losses) at end of year . . $1,858 $1,861 $(144)
Net pretax unrealized investment gains totaled $2.83 billion at both December 31, 2010 and 2009,
compared with net pretax unrealized losses of $253 million at December 31, 2008. The Company’s fixed
maturities and equity securities portfolios at December 31, 2010 experienced increases in valuations
compared with the prior year-end, which were offset by a decrease in net unrealized appreciation on
other investments that primarily resulted from the Company’s sale of substantially all of its remaining
common stock holdings in Verisk Analytics, Inc. That sale generated a pretax realized investment gain
of $205 million in 2010. The improvement in the Company’s net unrealized gain position at
December 31, 2009 over the prior year end is primarily attributable to the Company’s fixed maturity
investments. In 2009, yields on municipal fixed maturity securities declined, which increased the market
value of the Company’s portfolio of such securities. In addition, in 2009 credit spreads narrowed on
other non-municipal fixed maturity securities which also resulted in an increase in the market value of
those securities.
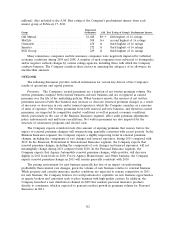
The following table summarizes, for all fixed maturities and equity securities reported at fair value
for which fair value is less than 80% of amortized cost at December 31, 2010, the gross unrealized
investment loss by length of time those securities have continuously been in an unrealized loss position
of greater than 20% of amortized cost:
Period For Which Fair Value Is Less Than 80% of Amortized Cost
Greater Than Greater Than
3 Months, 6 Months,
3 Months 6 Months 12 Months Greater Than
(in millions) or Less or Less or Less 12 Months Total
Fixed maturities:
Mortgage-backed securities ............ $— $— $— $ 8 $ 8
Other ........................... 2——1012
Total fixed maturities ............... 2——1820
Equity securities ..................... —————
Total .............................. $ 2 $— $— $18 $20
These unrealized investment losses at December 31, 2010 represent less than 1% of the combined
fixed maturity and equity security portfolios on a pretax basis and less than 1% of shareholders’ equity
on an after-tax basis.
For fixed maturity investments where fair value is less than the carrying value and the Company
did not reach a decision to impair, the Company continues to have the intent and ability to hold such
investments to a projected recovery in value, which may not be until maturity.
106