Travelers 2010 Annual Report Download - page 25
Download and view the complete annual report
Please find page 25 of the 2010 Travelers annual report below. You can navigate through the pages in the report by either clicking on the pages listed below, or by using the keyword search tool below to find specific information within the annual report.-
 1
1 -
2
-
3
-
4
-
5
-
6
-
7
-
8
-
9
-
10
-
11
-
12
-
13
-
14
-
 15
15 -
 16
16 -
 17
17 -
 18
18 -
 19
19 -
 20
20 -
 21
21 -
 22
22 -
 23
23 -
 24
24 -
 25
25 -
 26
26 -
 27
27 -
 28
28 -
 29
29 -
 30
30 -
 31
31 -
 32
32 -
 33
33 -
 34
34 -
 35
35 -
36
-
37
-
38
-
39
-
40
-
41
-
42
-
43
-
44
-
45
-
46
-
47
-
48
-
49
-
50
-
51
-
52
-
53
-
54
-
55
-
56
-
57
-
58
-
59
-
60
-
61
-
62
-
63
-
64
-
65
-
66
-
67
-
68
-
69
-
70
-
71
-
72
-
73
-
74
-
75
-
76
-
77
-
78
-
79
-
80
-
81
-
82
-
83
-
84
-
85
-
86
-
87
-
88
-
89
-
90
-
91
-
92
-
93
-
94
-
95
-
96
-
97
-
98
-
99
-
100
-
101
-
102
-
103
-
104
-
105
-
106
-
107
-
108
-
109
-
110
-
111
-
112
-
113
-
114
-
115
-
116
-
117
-
118
-
119
-
120
-
121
-
122
-
123
-
124
-
125
-
126
-
127
-
128
-
129
-
130
-
131
-
132
-
133
-
134
-
135
-
136
-
137
-
138
-
139
-
140
-
141
-
142
-
143
-
144
-
145
-
146
-
147
-
148
-
149
-
150
-
151
-
152
-
153
-
154
-
155
-
156
-
157
-
158
-
159
-
160
-
161
-
162
-
163
-
164
-
165
-
166
-
167
-
168
-
169
-
170
-
171
-
172
-
173
-
174
-
175
-
176
-
177
-
178
-
179
-
180
-
181
-
182
-
183
-
184
-
185
-
186
-
187
-
188
-
189
-
190
-
191
-
192
-
193
-
194
-
195
-
196
-
197
-
198
-
199
-
200
-
201
-
202
-
203
-
204
-
205
-
206
-
207
-
208
-
209
-
210
-
211
-
212
-
213
-
214
-
215
-
216
-
217
-
218
-
219
-
220
-
221
-
222
-
223
-
224
-
225
-
226
-
227
-
228
-
229
-
230
-
231
-
232
-
233
-
234
-
235
-
236
-
237
-
238
-
239
-
240
-
241
-
242
-
243
-
244
-
245
-
246
-
247
-
248
-
249
-
250
-
251
-
252
-
253
-
254
-
255
-
256
-
257
-
258
-
259
-
260
-
261
-
262
-
263
-
264
-
265
-
266
-
267
-
268
-
269
-
270
-
271
-
272
-
273
-
274
-
275
-
276
-
277
-
278
-
279
-
280
-
281
-
282
-
283
-
284
-
285
-
286
-
287
-
288
-
289
-
290
-
291
-
292
 |
 |

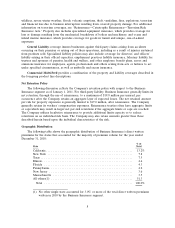
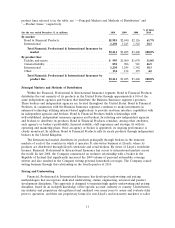
Geographic Distribution
The following table shows the geographic distribution of Financial, Professional & International’s
direct written premiums for the states that accounted for the majority of premium volume for the year
ended December 31, 2010:
% of
State Total
California .................................................. 6.0%
New York ................................................. 5.1
Texas ..................................................... 4.8
Florida ................................................... 3.1
Illinois .................................................... 3.1
All other domestic(1) ......................................... 40.1
Total domestic ............................................. 62.2
Total international .......................................... 37.8
Total ................................................... 100.0%
(1) No other single state within the United States accounted for 3.0% or more of the total
direct written premiums written in 2010 by the domestic operations of the Financial,
Professional & International Insurance segment.
Competition
The competitive landscape in which Bond & Financial Products operates is affected by many of
the same factors described previously for the Business Insurance segment. Competitors in this market
are primarily national property and casualty insurance companies that write most classes of business
using traditional products and pricing and, to a lesser extent, regional insurance companies and
companies that have developed niche programs for specific industry segments.
Bond & Financial Products underwrites and markets its products to national, mid-sized and small
businesses and organizations, as well as individuals, and distributes them through both national and
wholesale brokers, regional brokers and retail agents. Its reputation for timely and consistent decision
making, a nationwide network of local underwriting, claims and industry experts and strong producer
and customer relationships, as well as its ability to offer its customers a full range of products, provides
Bond & Financial Products an advantage over many of its competitors and enables it to compete
effectively in a complex, dynamic marketplace. The ability of Bond & Financial Products to cross-sell
its products to customers of the Business Insurance and Personal Insurance segments provides
additional competitive advantages for the Company.
International competes with numerous international and domestic insurers in the United Kingdom,
Canada and the Republic of Ireland. Companies compete on the basis of price, product offerings and
the level of claim and risk management services provided. The Company has developed expertise in
various markets in these countries similar to those served in the United States and provides both
property and casualty coverage for these markets. Products are generally distributed through a
relatively small agent and broker base whose customer groups align with the Company’s targeted
markets.
At Lloyd’s, International competes with other syndicates operating in the Lloyd’s market as well as
international and domestic insurers in the various markets where the Lloyd’s operation writes business
worldwide. Competition is again based on price, product and service. The Company focuses on lines it
believes it can underwrite effectively and profitably with an emphasis on short-tail insurance lines.
13