Travelers 2010 Annual Report Download - page 29
Download and view the complete annual report
Please find page 29 of the 2010 Travelers annual report below. You can navigate through the pages in the report by either clicking on the pages listed below, or by using the keyword search tool below to find specific information within the annual report.-
 1
1 -
2
-
3
-
4
-
5
-
6
-
7
-
8
-
9
-
10
-
11
-
12
-
13
-
14
-
15
-
16
-
17
-
18
-
 19
19 -
 20
20 -
 21
21 -
 22
22 -
 23
23 -
 24
24 -
 25
25 -
 26
26 -
 27
27 -
 28
28 -
 29
29 -
 30
30 -
 31
31 -
 32
32 -
 33
33 -
 34
34 -
 35
35 -
 36
36 -
 37
37 -
 38
38 -
 39
39 -
40
-
41
-
42
-
43
-
44
-
45
-
46
-
47
-
48
-
49
-
50
-
51
-
52
-
53
-
54
-
55
-
56
-
57
-
58
-
59
-
60
-
61
-
62
-
63
-
64
-
65
-
66
-
67
-
68
-
69
-
70
-
71
-
72
-
73
-
74
-
75
-
76
-
77
-
78
-
79
-
80
-
81
-
82
-
83
-
84
-
85
-
86
-
87
-
88
-
89
-
90
-
91
-
92
-
93
-
94
-
95
-
96
-
97
-
98
-
99
-
100
-
101
-
102
-
103
-
104
-
105
-
106
-
107
-
108
-
109
-
110
-
111
-
112
-
113
-
114
-
115
-
116
-
117
-
118
-
119
-
120
-
121
-
122
-
123
-
124
-
125
-
126
-
127
-
128
-
129
-
130
-
131
-
132
-
133
-
134
-
135
-
136
-
137
-
138
-
139
-
140
-
141
-
142
-
143
-
144
-
145
-
146
-
147
-
148
-
149
-
150
-
151
-
152
-
153
-
154
-
155
-
156
-
157
-
158
-
159
-
160
-
161
-
162
-
163
-
164
-
165
-
166
-
167
-
168
-
169
-
170
-
171
-
172
-
173
-
174
-
175
-
176
-
177
-
178
-
179
-
180
-
181
-
182
-
183
-
184
-
185
-
186
-
187
-
188
-
189
-
190
-
191
-
192
-
193
-
194
-
195
-
196
-
197
-
198
-
199
-
200
-
201
-
202
-
203
-
204
-
205
-
206
-
207
-
208
-
209
-
210
-
211
-
212
-
213
-
214
-
215
-
216
-
217
-
218
-
219
-
220
-
221
-
222
-
223
-
224
-
225
-
226
-
227
-
228
-
229
-
230
-
231
-
232
-
233
-
234
-
235
-
236
-
237
-
238
-
239
-
240
-
241
-
242
-
243
-
244
-
245
-
246
-
247
-
248
-
249
-
250
-
251
-
252
-
253
-
254
-
255
-
256
-
257
-
258
-
259
-
260
-
261
-
262
-
263
-
264
-
265
-
266
-
267
-
268
-
269
-
270
-
271
-
272
-
273
-
274
-
275
-
276
-
277
-
278
-
279
-
280
-
281
-
282
-
283
-
284
-
285
-
286
-
287
-
288
-
289
-
290
-
291
-
292
 |
 |

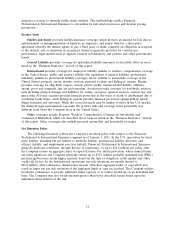
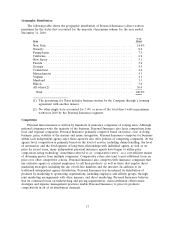
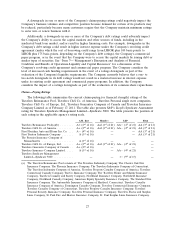
Geographic Distribution
The following table shows the geographic distribution of Personal Insurance’s direct written
premiums for the states that accounted for the majority of premium volume for the year ended
December 31, 2010:
% of
State Total
New York ................................................. 14.4%
Texas(1) ................................................... 8.2
Pennsylvania ................................................ 7.5
California .................................................. 6.2
New Jersey ................................................ 5.1
Florida ................................................... 5.0
Georgia ................................................... 4.5
Connecticut ................................................ 4.4
Massachusetts .............................................. 4.3
Virginia ................................................... 4.1
Maryland .................................................. 3.3
Illinois .................................................... 3.0
All others(2) ............................................... 30.0
Total ................................................... 100.0%
(1) The percentage for Texas includes business written by the Company through a fronting
agreement with another insurer.
(2) No other single state accounted for 3.0% or more of the total direct written premiums
written in 2010 by the Personal Insurance segment.
Competition
Personal lines insurance is written by hundreds of insurance companies of varying sizes. Although
national companies write the majority of the business, Personal Insurance also faces competition from
local and regional companies. Personal Insurance primarily competes based on service, ease of doing
business, price, stability of the insurer and name recognition. Personal Insurance competes for business
within each independent agency since these agencies also offer policies of competing companies. At the
agency level, competition is primarily based on the level of service, including claims handling, the level
of automation and the development of long-term relationships with individual agents, as well as on
price. In recent years, many independent personal insurance agents have begun to utilize price
comparison rating technology, sometimes referred to as ‘‘comparative raters,’’ as a cost-efficient means
of obtaining quotes from multiple companies. Comparative raters also tend to put additional focus on
price over other competitive criteria. Personal Insurance also competes with insurance companies that
use exclusive agents or salaried employees to sell their products, as well as those that employ direct
marketing strategies, including the use of toll-free numbers and the internet. In addition to its
traditional independent agency distribution, Personal Insurance has broadened its distribution of
products by marketing to sponsoring organizations, including employee and affinity groups, through
joint marketing arrangements with other insurers, and direct marketing. Personal Insurance believes
that its continued focus on underwriting and pricing segmentation, claim settlement effectiveness
strategies and expense management practices enable Personal Insurance to price its products
competitively in all of its distribution channels.
17