Travelers 2010 Annual Report Download - page 204
Download and view the complete annual report
Please find page 204 of the 2010 Travelers annual report below. You can navigate through the pages in the report by either clicking on the pages listed below, or by using the keyword search tool below to find specific information within the annual report.-
 1
1 -
2
-
3
-
4
-
5
-
6
-
7
-
8
-
9
-
10
-
11
-
12
-
13
-
14
-
15
-
16
-
17
-
18
-
19
-
20
-
21
-
22
-
23
-
24
-
25
-
26
-
27
-
28
-
29
-
30
-
31
-
32
-
33
-
34
-
35
-
36
-
37
-
38
-
39
-
40
-
41
-
42
-
43
-
44
-
45
-
46
-
47
-
48
-
49
-
50
-
51
-
52
-
53
-
54
-
55
-
56
-
57
-
58
-
59
-
60
-
61
-
62
-
63
-
64
-
65
-
66
-
67
-
68
-
69
-
70
-
71
-
72
-
73
-
74
-
75
-
76
-
77
-
78
-
79
-
80
-
81
-
82
-
83
-
84
-
85
-
86
-
87
-
88
-
89
-
90
-
91
-
92
-
93
-
94
-
95
-
96
-
97
-
98
-
99
-
100
-
101
-
102
-
103
-
104
-
105
-
106
-
107
-
108
-
109
-
110
-
111
-
112
-
113
-
114
-
115
-
116
-
117
-
118
-
119
-
120
-
121
-
122
-
123
-
124
-
125
-
126
-
127
-
128
-
129
-
130
-
131
-
132
-
133
-
134
-
135
-
136
-
137
-
138
-
139
-
140
-
141
-
142
-
143
-
144
-
145
-
146
-
147
-
148
-
149
-
150
-
151
-
152
-
153
-
154
-
155
-
156
-
157
-
158
-
159
-
160
-
161
-
162
-
163
-
164
-
165
-
166
-
167
-
168
-
169
-
170
-
171
-
172
-
173
-
174
-
175
-
176
-
177
-
178
-
179
-
180
-
181
-
182
-
183
-
184
-
185
-
186
-
187
-
188
-
189
-
190
-
191
-
192
-
193
-
 194
194 -
 195
195 -
 196
196 -
 197
197 -
 198
198 -
 199
199 -
 200
200 -
 201
201 -
 202
202 -
 203
203 -
 204
204 -
 205
205 -
 206
206 -
 207
207 -
 208
208 -
 209
209 -
 210
210 -
 211
211 -
 212
212 -
 213
213 -
 214
214 -
215
-
216
-
217
-
218
-
219
-
220
-
221
-
222
-
223
-
224
-
225
-
226
-
227
-
228
-
229
-
230
-
231
-
232
-
233
-
234
-
235
-
236
-
237
-
238
-
239
-
240
-
241
-
242
-
243
-
244
-
245
-
246
-
247
-
248
-
249
-
250
-
251
-
252
-
253
-
254
-
255
-
256
-
257
-
258
-
259
-
260
-
261
-
262
-
263
-
264
-
265
-
266
-
267
-
268
-
269
-
270
-
271
-
272
-
273
-
274
-
275
-
276
-
277
-
278
-
279
-
280
-
281
-
282
-
283
-
284
-
285
-
286
-
287
-
288
-
289
-
290
-
291
-
292
 |
 |

THE TRAVELERS COMPANIES, INC. AND SUBSIDIARIES
NOTES TO CONSOLIDATED FINANCIAL STATEMENTS (Continued)
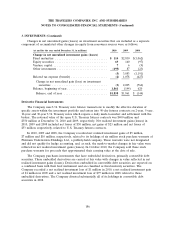
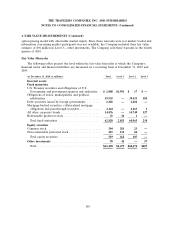
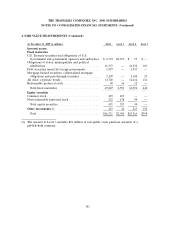
4. FAIR VALUE MEASUREMENTS (Continued)
The following tables present the changes in the Level 3 fair value category for the years ended
December 31, 2010 and 2009.
Fixed Other
(in millions) Maturities Investments Total
Balance at December 31, 2009 .............................. $240 $ 154 $ 394
Total realized and unrealized investment gains (losses):
Included in realized investment gains (losses)(1) ................ 527
Included in increases (decreases) in accumulated other changes in
equity from nonowner sources ........................... 10 11 21
Purchases, sales and settlements/maturities:
Purchases ............................................ 44 3 47
Sales ............................................... (9) (113) (122)
Settlements/maturities ................................... (41) — (41)
Gross transfers into Level 3 ................................ 13 — 13
Gross transfers out of Level 3 ............................... (32) — (32)
Balance at December 31, 2010 ........................... $230 $ 57 $ 287
Amount of total realized investment gains (losses) for the period
included in the consolidated statement of income attributable to
changes in the fair value of assets still held at the reporting date .... $— $ — $ —
(1) Includes impairments on investments held at the end of the period as well as amortization on fixed
maturities.
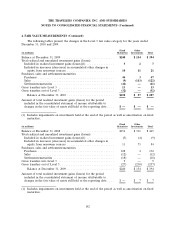
Fixed Other
(in millions) Maturities Investments Total
Balance at December 31, 2008 .............................. $154 $311 $465
Total realized and unrealized investment gains (losses):
Included in realized investment gains (losses)(1) ................ (5) (4) (9)
Included in increases (decreases) in accumulated other changes in
equity from nonowner sources ........................... 11 73 84
Purchases, sales and settlements/maturities:
Purchases ............................................ 128 4 132
Sales ............................................... (12) — (12)
Settlements/maturities ................................... (18) — (18)
Gross transfers into Level 3 ................................ 9 — 9
Gross transfers out of Level 3 ............................... (27) (230) (257)
Balance at December 31, 2009 ........................... $240 $154 $394
Amount of total realized investment gains (losses) for the period
included in the consolidated statement of income attributable to
changes in the fair value of assets still held at the reporting date .... $ — $ 7 $ 7
(1) Includes impairments on investments held at the end of the period as well as amortization on fixed
maturities.
192