Travelers 2010 Annual Report Download - page 191
Download and view the complete annual report
Please find page 191 of the 2010 Travelers annual report below. You can navigate through the pages in the report by either clicking on the pages listed below, or by using the keyword search tool below to find specific information within the annual report.-
 1
1 -
2
-
3
-
4
-
5
-
6
-
7
-
8
-
9
-
10
-
11
-
12
-
13
-
14
-
15
-
16
-
17
-
18
-
19
-
20
-
21
-
22
-
23
-
24
-
25
-
26
-
27
-
28
-
29
-
30
-
31
-
32
-
33
-
34
-
35
-
36
-
37
-
38
-
39
-
40
-
41
-
42
-
43
-
44
-
45
-
46
-
47
-
48
-
49
-
50
-
51
-
52
-
53
-
54
-
55
-
56
-
57
-
58
-
59
-
60
-
61
-
62
-
63
-
64
-
65
-
66
-
67
-
68
-
69
-
70
-
71
-
72
-
73
-
74
-
75
-
76
-
77
-
78
-
79
-
80
-
81
-
82
-
83
-
84
-
85
-
86
-
87
-
88
-
89
-
90
-
91
-
92
-
93
-
94
-
95
-
96
-
97
-
98
-
99
-
100
-
101
-
102
-
103
-
104
-
105
-
106
-
107
-
108
-
109
-
110
-
111
-
112
-
113
-
114
-
115
-
116
-
117
-
118
-
119
-
120
-
121
-
122
-
123
-
124
-
125
-
126
-
127
-
128
-
129
-
130
-
131
-
132
-
133
-
134
-
135
-
136
-
137
-
138
-
139
-
140
-
141
-
142
-
143
-
144
-
145
-
146
-
147
-
148
-
149
-
150
-
151
-
152
-
153
-
154
-
155
-
156
-
157
-
158
-
159
-
160
-
161
-
162
-
163
-
164
-
165
-
166
-
167
-
168
-
169
-
170
-
171
-
172
-
173
-
174
-
175
-
176
-
177
-
178
-
179
-
180
-
 181
181 -
 182
182 -
 183
183 -
 184
184 -
 185
185 -
 186
186 -
 187
187 -
 188
188 -
 189
189 -
 190
190 -
 191
191 -
 192
192 -
 193
193 -
 194
194 -
 195
195 -
 196
196 -
 197
197 -
 198
198 -
 199
199 -
 200
200 -
 201
201 -
202
-
203
-
204
-
205
-
206
-
207
-
208
-
209
-
210
-
211
-
212
-
213
-
214
-
215
-
216
-
217
-
218
-
219
-
220
-
221
-
222
-
223
-
224
-
225
-
226
-
227
-
228
-
229
-
230
-
231
-
232
-
233
-
234
-
235
-
236
-
237
-
238
-
239
-
240
-
241
-
242
-
243
-
244
-
245
-
246
-
247
-
248
-
249
-
250
-
251
-
252
-
253
-
254
-
255
-
256
-
257
-
258
-
259
-
260
-
261
-
262
-
263
-
264
-
265
-
266
-
267
-
268
-
269
-
270
-
271
-
272
-
273
-
274
-
275
-
276
-
277
-
278
-
279
-
280
-
281
-
282
-
283
-
284
-
285
-
286
-
287
-
288
-
289
-
290
-
291
-
292
 |
 |

THE TRAVELERS COMPANIES, INC. AND SUBSIDIARIES
NOTES TO CONSOLIDATED FINANCIAL STATEMENTS (Continued)
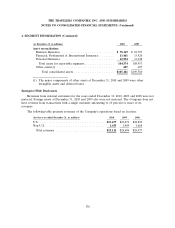
3. INVESTMENTS (Continued)
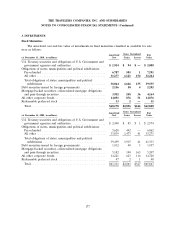
At December 31, 2010 and 2009, the Company’s insurance subsidiaries had $4.51 billion and
$4.46 billion, respectively, of securities on deposit at financial institutions in certain states pursuant to
the respective states’ insurance regulatory requirements. Funds deposited with third parties to be used
as collateral to secure various liabilities on behalf of insureds, cedants and other creditors had a fair
value of $86 million and $103 million at December 31, 2010 and 2009, respectively. Other investments
pledged as collateral securing outstanding letters of credit had a fair value of $88 million and
$98 million at December 31, 2010 and 2009, respectively.
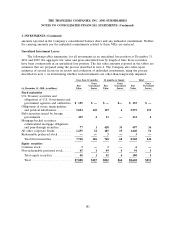
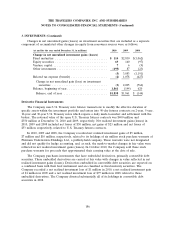
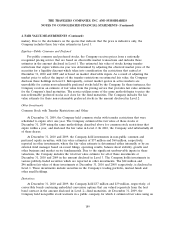
Equity Securities
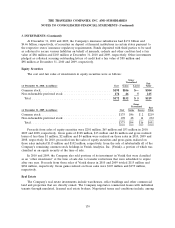
The cost and fair value of investments in equity securities were as follows:
Gross
Unrealized Fair
(at December 31, 2010, in millions) Cost Gains Losses Value
Common stock ........................................ $198 $106 $— $304
Non-redeemable preferred stock ........................... 174 46 5 215
Total ............................................. $372 $152 $ 5 $519
Gross
Unrealized Fair
(at December 31, 2009, in millions) Cost Gains Losses Value
Common stock ........................................... $175 $46 $ 2 $219
Non-redeemable preferred stock .............................. 198 48 14 232
Total ................................................. $373 $94 $16 $451
Proceeds from sales of equity securities were $201 million, $65 million and $53 million in 2010,
2009 and 2008, respectively. Gross gains of $128 million, $13 million and $6 million and gross realized
losses of less than $1 million, $2 million and $4 million were realized on those sales in 2010, 2009 and
2008, respectively. In 2010, proceeds from the sales of equity securities and gross gains realized on
those sales included $115 million and $102 million, respectively, from the sale of substantially all of the
Company’s remaining common stock holdings in Verisk Analytics, Inc. (Verisk), a portion of which was
classified as an equity security at the time of sale.
In 2010 and 2009, the Company also sold portions of its investment in Verisk that were classified
as an ‘‘other investment’’ at the time of sale due to transfer restrictions that were scheduled to expire
after one year. Proceeds from those sales of Verisk shares in 2010 and 2009 totaled $115 million and
$184 million, respectively. Gross gains realized on those sales were $103 million and $159 million,
respectively.
Real Estate
The Company’s real estate investments include warehouses, office buildings and other commercial
land and properties that are directly owned. The Company negotiates commercial leases with individual
tenants through unrelated, licensed real estate brokers. Negotiated terms and conditions include, among
179