Travelers 2010 Annual Report Download - page 127
Download and view the complete annual report
Please find page 127 of the 2010 Travelers annual report below. You can navigate through the pages in the report by either clicking on the pages listed below, or by using the keyword search tool below to find specific information within the annual report.-
 1
1 -
2
-
3
-
4
-
5
-
6
-
7
-
8
-
9
-
10
-
11
-
12
-
13
-
14
-
15
-
16
-
17
-
18
-
19
-
20
-
21
-
22
-
23
-
24
-
25
-
26
-
27
-
28
-
29
-
30
-
31
-
32
-
33
-
34
-
35
-
36
-
37
-
38
-
39
-
40
-
41
-
42
-
43
-
44
-
45
-
46
-
47
-
48
-
49
-
50
-
51
-
52
-
53
-
54
-
55
-
56
-
57
-
58
-
59
-
60
-
61
-
62
-
63
-
64
-
65
-
66
-
67
-
68
-
69
-
70
-
71
-
72
-
73
-
74
-
75
-
76
-
77
-
78
-
79
-
80
-
81
-
82
-
83
-
84
-
85
-
86
-
87
-
88
-
89
-
90
-
91
-
92
-
93
-
94
-
95
-
96
-
97
-
98
-
99
-
100
-
101
-
102
-
103
-
104
-
105
-
106
-
107
-
108
-
109
-
110
-
111
-
112
-
113
-
114
-
115
-
116
-
 117
117 -
 118
118 -
 119
119 -
 120
120 -
 121
121 -
 122
122 -
 123
123 -
 124
124 -
 125
125 -
 126
126 -
 127
127 -
 128
128 -
 129
129 -
 130
130 -
 131
131 -
 132
132 -
 133
133 -
 134
134 -
 135
135 -
 136
136 -
 137
137 -
138
-
139
-
140
-
141
-
142
-
143
-
144
-
145
-
146
-
147
-
148
-
149
-
150
-
151
-
152
-
153
-
154
-
155
-
156
-
157
-
158
-
159
-
160
-
161
-
162
-
163
-
164
-
165
-
166
-
167
-
168
-
169
-
170
-
171
-
172
-
173
-
174
-
175
-
176
-
177
-
178
-
179
-
180
-
181
-
182
-
183
-
184
-
185
-
186
-
187
-
188
-
189
-
190
-
191
-
192
-
193
-
194
-
195
-
196
-
197
-
198
-
199
-
200
-
201
-
202
-
203
-
204
-
205
-
206
-
207
-
208
-
209
-
210
-
211
-
212
-
213
-
214
-
215
-
216
-
217
-
218
-
219
-
220
-
221
-
222
-
223
-
224
-
225
-
226
-
227
-
228
-
229
-
230
-
231
-
232
-
233
-
234
-
235
-
236
-
237
-
238
-
239
-
240
-
241
-
242
-
243
-
244
-
245
-
246
-
247
-
248
-
249
-
250
-
251
-
252
-
253
-
254
-
255
-
256
-
257
-
258
-
259
-
260
-
261
-
262
-
263
-
264
-
265
-
266
-
267
-
268
-
269
-
270
-
271
-
272
-
273
-
274
-
275
-
276
-
277
-
278
-
279
-
280
-
281
-
282
-
283
-
284
-
285
-
286
-
287
-
288
-
289
-
290
-
291
-
292
 |
 |
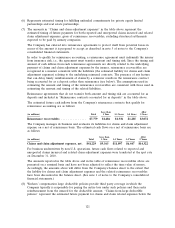
The Company currently utilizes uncollateralized letters of credit issued by major banks with an
aggregate limit of approximately $537 million to provide much of the capital needed to support its
obligations at Lloyd’s. If uncollateralized letters of credit are not available at a reasonable price or at
all in the future, the Company can collateralize these letters of credit or may have to seek alternative
means of supporting its obligations at Lloyd’s, which could include utilizing holding company funds on
hand.
Operating Activities
Net cash flows provided by operating activities totaled $3.05 billion, $4.23 billion and $3.14 billion
in 2010, 2009 and 2008, respectively. Cash flows in 2010 reflected a higher level of claims and claim
adjustment expense payments due to the impact of loss cost trends and a higher level of catastrophe
loss payments, as well as a lower level of reinsurance recoveries, partially offset by declines in the
amount of contributions to the Company’s pension plan and lower claims and claim adjustment expense
payments related to operations in runoff as compared with 2009. Cash flows in 2009 reflected a decline
in catastrophe loss payments, a higher level of reinsurance recoveries, a reduction in the amount of
contributions to the Company’s pension plan and lower claims and claim adjustment expense payments
related to operations in runoff as compared with 2008. Those runoff payments in 2008 included the
Company’s one-time net payment of $365 million associated with the final settlement of asbestos claims
related to ACandS, Inc. In the years ended December 31, 2010, 2009 and 2008, the Company
contributed $35 million, $260 million and $450 million, respectively, to its pension plan.
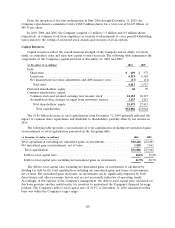
Investing Activities
Net cash flows provided by investing activities totaled $2.11 billion in 2010, compared with net cash
flows used in investing activities of $899 million and $162 million in 2009 and 2008, respectively. The
Company’s consolidated total investments at December 31, 2010 decreased by $2.24 billion from
year-end 2009, driven by the net sales and maturities of fixed maturity investments. The proceeds from
those sales and maturities, along with operating cash flows of $3.05 billion in 2010, were the primary
sources of funding for the Company’s $5.04 billion of common share repurchases in 2010. Net pretax
unrealized appreciation of investments at December 31, 2010 was virtually unchanged from the same
date in 2009. The Company’s consolidated total investments at December 31, 2009 increased by
$4.23 billion from year-end 2008, primarily reflecting a $3.08 billion pretax increase in the unrealized
appreciation of investments since year-end 2008 and investment purchases resulting from strong cash
flows from operations, partially offset by $3.29 billion of common share repurchases made during 2009.
The improvement in the Company’s net unrealized investment gain position at December 31, 2009 over
the prior year is primarily attributable to the Company’s fixed maturity investments. The improved
valuations on these holdings reflect the changing market conditions in 2009 which included a significant
narrowing of credit spreads.
In the first half of 2011, the Company expects to fund its investment in J. Malucelli with cash from
internal sources. See ‘‘Part I—Item 1—Financial, Professional & International Insurance’’ in this report
for further information regarding this investment.
The primary goals of the Company’s asset—liability management process are to satisfy the
insurance liabilities and maintain sufficient liquidity to cover fluctuations in projected liability cash
flows. Generally, the expected principal and interest payments produced by the Company’s fixed
maturity portfolio adequately fund the estimated runoff of the Company’s insurance reserves. Although
this is not an exact cash flow match in each period, the substantial degree by which the market value of
the fixed maturity portfolio exceeds the expected present value of the net insurance liabilities, as well
as the positive cash flow from newly sold policies and the large amount of high quality liquid bonds,
contributes to the Company’s ability to fund claim payments without having to sell illiquid assets or
access credit facilities.
115