Travelers 2010 Annual Report Download - page 96
Download and view the complete annual report
Please find page 96 of the 2010 Travelers annual report below. You can navigate through the pages in the report by either clicking on the pages listed below, or by using the keyword search tool below to find specific information within the annual report.-
 1
1 -
2
-
3
-
4
-
5
-
6
-
7
-
8
-
9
-
10
-
11
-
12
-
13
-
14
-
15
-
16
-
17
-
18
-
19
-
20
-
21
-
22
-
23
-
24
-
25
-
26
-
27
-
28
-
29
-
30
-
31
-
32
-
33
-
34
-
35
-
36
-
37
-
38
-
39
-
40
-
41
-
42
-
43
-
44
-
45
-
46
-
47
-
48
-
49
-
50
-
51
-
52
-
53
-
54
-
55
-
56
-
57
-
58
-
59
-
60
-
61
-
62
-
63
-
64
-
65
-
66
-
67
-
68
-
69
-
70
-
71
-
72
-
73
-
74
-
75
-
76
-
77
-
78
-
79
-
80
-
81
-
82
-
83
-
84
-
85
-
 86
86 -
 87
87 -
 88
88 -
 89
89 -
 90
90 -
 91
91 -
 92
92 -
 93
93 -
 94
94 -
 95
95 -
 96
96 -
 97
97 -
 98
98 -
 99
99 -
 100
100 -
 101
101 -
 102
102 -
 103
103 -
 104
104 -
 105
105 -
 106
106 -
107
-
108
-
109
-
110
-
111
-
112
-
113
-
114
-
115
-
116
-
117
-
118
-
119
-
120
-
121
-
122
-
123
-
124
-
125
-
126
-
127
-
128
-
129
-
130
-
131
-
132
-
133
-
134
-
135
-
136
-
137
-
138
-
139
-
140
-
141
-
142
-
143
-
144
-
145
-
146
-
147
-
148
-
149
-
150
-
151
-
152
-
153
-
154
-
155
-
156
-
157
-
158
-
159
-
160
-
161
-
162
-
163
-
164
-
165
-
166
-
167
-
168
-
169
-
170
-
171
-
172
-
173
-
174
-
175
-
176
-
177
-
178
-
179
-
180
-
181
-
182
-
183
-
184
-
185
-
186
-
187
-
188
-
189
-
190
-
191
-
192
-
193
-
194
-
195
-
196
-
197
-
198
-
199
-
200
-
201
-
202
-
203
-
204
-
205
-
206
-
207
-
208
-
209
-
210
-
211
-
212
-
213
-
214
-
215
-
216
-
217
-
218
-
219
-
220
-
221
-
222
-
223
-
224
-
225
-
226
-
227
-
228
-
229
-
230
-
231
-
232
-
233
-
234
-
235
-
236
-
237
-
238
-
239
-
240
-
241
-
242
-
243
-
244
-
245
-
246
-
247
-
248
-
249
-
250
-
251
-
252
-
253
-
254
-
255
-
256
-
257
-
258
-
259
-
260
-
261
-
262
-
263
-
264
-
265
-
266
-
267
-
268
-
269
-
270
-
271
-
272
-
273
-
274
-
275
-
276
-
277
-
278
-
279
-
280
-
281
-
282
-
283
-
284
-
285
-
286
-
287
-
288
-
289
-
290
-
291
-
292
 |
 |
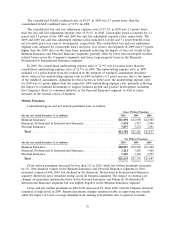
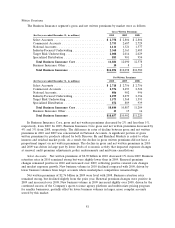
exchange rates, earned premiums in this segment in 2009 were slightly higher than in 2008, primarily
reflecting growth in International.
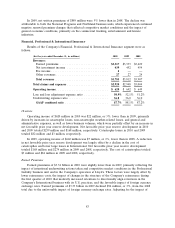
Net Investment Income
Net investment income in 2010 decreased by $13 million compared with 2009. Included in the
Financial, Professional & International Insurance segment are certain legal entities whose invested
assets and related net investment income are reported exclusively in this segment and not allocated
among all business segments. As a result, reported net investment income in the Financial,
Professional & International Insurance segment reflects a significantly smaller proportion of allocated
net investment income, including that from the Company’s non-fixed maturity investments that
experienced a substantial increase in investment income in 2010. Refer to the ‘‘Net Investment Income’’
section of ‘‘Consolidated Results of Operations’’ herein for a discussion of the change in the
Company’s consolidated net investment income in 2010 and 2009 as compared with the respective prior
years. In addition, refer to note 2 of notes to the Company’s consolidated financial statements for a
discussion of the Company’s net investment income allocation methodology. In 2009, the slight decline
in net investment income compared with 2008 was primarily driven by the unfavorable impact of
foreign currency exchange rates, which reduced reported net investment income by approximately
$18 million in 2009.
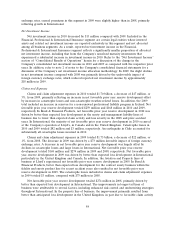
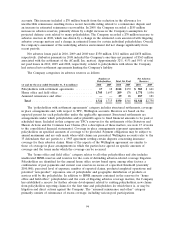
Claims and Expenses
Claims and claim adjustment expenses in 2010 totaled $1.70 billion, a decrease of $47 million, or
3%, from 2009, primarily reflecting an increase in net favorable prior year reserve development offset
by increases in catastrophe losses and non-catastrophe weather-related losses. In addition, the 2009
total included an increase in reserves for a non-renewed professional liability program in Ireland. Net
favorable prior year reserve development totaled $259 million and $168 million in 2010 and 2009,
respectively In Bond & Financial Products, net favorable prior year reserve development in 2010 was
driven by better than expected loss development in the surety and management liability lines of
business due to lower than expected claim activity and loss severity in the 2008 and prior accident
years. In International, the majority of net favorable prior year reserve development in 2010 occurred
at the Company’s operation at Lloyd’s, in Canada and in the United Kingdom. Catastrophe losses in
2010 and 2009 totaled $82 million and $3 million, respectively. An earthquake in Chile accounted for
substantially all catastrophe losses incurred in 2010.
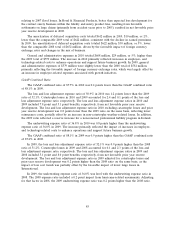
Claims and claim adjustment expenses in 2009 totaled $1.75 billion, a decrease of $22 million, or
1%, from 2008. The decrease in 2009 was driven by a $73 million favorable impact of foreign currency
exchange rates. A decrease in net favorable prior year reserve development was largely offset by
declines in catastrophe losses and large losses in International. Net favorable prior year reserve
development totaled $168 million and $274 million in 2009 and 2008, respectively. Net favorable prior
year reserve development in 2009 was driven by better than expected loss development in International,
particularly in the United Kingdom and Canada. In addition, the Aviation and Property lines of
business at Lloyd’s experienced net favorable prior year reserve development in 2009. In Bond &
Financial Products, better than expected loss development for the contract surety business within the
fidelity and surety product line for recent accident years also resulted in net favorable prior year
reserve development in 2009. The catastrophe losses included in claims and claim adjustment expenses
in 2009 totaled $3 million, compared with $73 million in 2008.
Net favorable prior year reserve development totaled $274 million in 2008, primarily driven by
better than expected loss development in International. The improvements in longer-tail lines of
business were attributable to several factors, including enhanced risk control and underwriting strategies
throughout International. In the property line of business, the improvement primarily resulted from
better than anticipated loss development in the United Kingdom, in part due to favorable claim activity
84