Travelers 2010 Annual Report Download - page 187
Download and view the complete annual report
Please find page 187 of the 2010 Travelers annual report below. You can navigate through the pages in the report by either clicking on the pages listed below, or by using the keyword search tool below to find specific information within the annual report.-
 1
1 -
2
-
3
-
4
-
5
-
6
-
7
-
8
-
9
-
10
-
11
-
12
-
13
-
14
-
15
-
16
-
17
-
18
-
19
-
20
-
21
-
22
-
23
-
24
-
25
-
26
-
27
-
28
-
29
-
30
-
31
-
32
-
33
-
34
-
35
-
36
-
37
-
38
-
39
-
40
-
41
-
42
-
43
-
44
-
45
-
46
-
47
-
48
-
49
-
50
-
51
-
52
-
53
-
54
-
55
-
56
-
57
-
58
-
59
-
60
-
61
-
62
-
63
-
64
-
65
-
66
-
67
-
68
-
69
-
70
-
71
-
72
-
73
-
74
-
75
-
76
-
77
-
78
-
79
-
80
-
81
-
82
-
83
-
84
-
85
-
86
-
87
-
88
-
89
-
90
-
91
-
92
-
93
-
94
-
95
-
96
-
97
-
98
-
99
-
100
-
101
-
102
-
103
-
104
-
105
-
106
-
107
-
108
-
109
-
110
-
111
-
112
-
113
-
114
-
115
-
116
-
117
-
118
-
119
-
120
-
121
-
122
-
123
-
124
-
125
-
126
-
127
-
128
-
129
-
130
-
131
-
132
-
133
-
134
-
135
-
136
-
137
-
138
-
139
-
140
-
141
-
142
-
143
-
144
-
145
-
146
-
147
-
148
-
149
-
150
-
151
-
152
-
153
-
154
-
155
-
156
-
157
-
158
-
159
-
160
-
161
-
162
-
163
-
164
-
165
-
166
-
167
-
168
-
169
-
170
-
171
-
172
-
173
-
174
-
175
-
176
-
 177
177 -
 178
178 -
 179
179 -
 180
180 -
 181
181 -
 182
182 -
 183
183 -
 184
184 -
 185
185 -
 186
186 -
 187
187 -
 188
188 -
 189
189 -
 190
190 -
 191
191 -
 192
192 -
 193
193 -
 194
194 -
 195
195 -
 196
196 -
 197
197 -
198
-
199
-
200
-
201
-
202
-
203
-
204
-
205
-
206
-
207
-
208
-
209
-
210
-
211
-
212
-
213
-
214
-
215
-
216
-
217
-
218
-
219
-
220
-
221
-
222
-
223
-
224
-
225
-
226
-
227
-
228
-
229
-
230
-
231
-
232
-
233
-
234
-
235
-
236
-
237
-
238
-
239
-
240
-
241
-
242
-
243
-
244
-
245
-
246
-
247
-
248
-
249
-
250
-
251
-
252
-
253
-
254
-
255
-
256
-
257
-
258
-
259
-
260
-
261
-
262
-
263
-
264
-
265
-
266
-
267
-
268
-
269
-
270
-
271
-
272
-
273
-
274
-
275
-
276
-
277
-
278
-
279
-
280
-
281
-
282
-
283
-
284
-
285
-
286
-
287
-
288
-
289
-
290
-
291
-
292
 |
 |

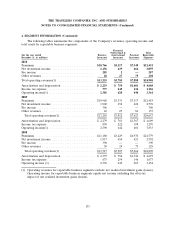
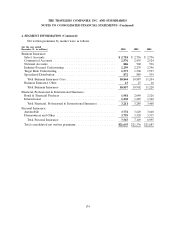
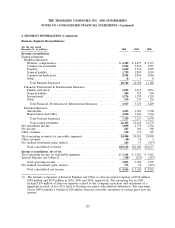
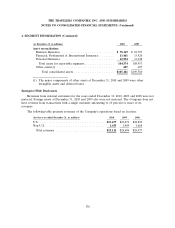
THE TRAVELERS COMPANIES, INC. AND SUBSIDIARIES
NOTES TO CONSOLIDATED FINANCIAL STATEMENTS (Continued)
2. SEGMENT INFORMATION (Continued)
Business Segment Reconciliations
(for the year ended
December 31, in millions) 2010 2009 2008
Revenue reconciliation
Earned premiums
Business Insurance:
Workers’ compensation ................................... $ 2,489 $ 2,457 $ 2,373
Commercial automobile .................................. 1,912 1,956 1,957
Property ............................................. 1,669 1,761 1,895
General liability ........................................ 1,739 1,899 1,959
Commercial multi-peril ................................... 2,958 2,894 2,988
Other ............................................... (1) 18
Total Business Insurance ................................ 10,766 10,968 11,180
Financial, Professional & International Insurance:
Fidelity and surety ...................................... 1,023 1,015 1,063
General liability ........................................ 884 929 904
International .......................................... 1,276 1,255 1,328
Other ............................................... 134 134 134
Total Financial, Professional & International Insurance ........... 3,317 3,333 3,429
Personal Insurance:
Automobile ........................................... 3,693 3,696 3,708
Homeowners and Other .................................. 3,656 3,421 3,262
Total Personal Insurance ................................ 7,349 7,117 6,970
Total earned premiums ................................. 21,432 21,418 21,579
Net investment income ...................................... 3,059 2,776 2,792
Fee income .............................................. 287 306 390
Other revenues ............................................ 130 153 129
Total operating revenues for reportable segments .................... 24,908 24,653 24,890
Other revenues ............................................ (60) 10 2
Net realized investment gains (losses) ............................ 264 17 (415)
Total consolidated revenues ................................ $25,112 $24,680 $24,477
Income reconciliation, net of tax
Total operating income for reportable segments ..................... $ 3,361 $ 3,833 $ 3,452
Interest Expense and Other(1) ................................. (318) (233) (257)
Total operating income ................................... 3,043 3,600 3,195
Net realized investment gains (losses) ............................ 173 22 (271)
Total consolidated net income .............................. $ 3,216 $ 3,622 $ 2,924
(1) The primary component of Interest Expense and Other is after-tax interest expense of $252 million,
$248 million and $239 million in 2010, 2009 and 2008, respectively. The operating loss in 2010
included $39 million of after-tax expenses related to the Company’s purchase and retirement of a
significant portion of its 6.25% fixed-to-floating rate junior subordinated debentures. The operating
loss in 2009 included a benefit of $28 million from the favorable resolution of various prior year tax
matters.
175