Travelers 2010 Annual Report Download - page 4
Download and view the complete annual report
Please find page 4 of the 2010 Travelers annual report below. You can navigate through the pages in the report by either clicking on the pages listed below, or by using the keyword search tool below to find specific information within the annual report.-
 1
1 -
 2
2 -
 3
3 -
 4
4 -
 5
5 -
 6
6 -
 7
7 -
 8
8 -
 9
9 -
 10
10 -
 11
11 -
 12
12 -
 13
13 -
 14
14 -
 15
15 -
16
-
17
-
18
-
19
-
20
-
21
-
22
-
23
-
24
-
25
-
26
-
27
-
28
-
29
-
30
-
31
-
32
-
33
-
34
-
35
-
36
-
37
-
38
-
39
-
40
-
41
-
42
-
43
-
44
-
45
-
46
-
47
-
48
-
49
-
50
-
51
-
52
-
53
-
54
-
55
-
56
-
57
-
58
-
59
-
60
-
61
-
62
-
63
-
64
-
65
-
66
-
67
-
68
-
69
-
70
-
71
-
72
-
73
-
74
-
75
-
76
-
77
-
78
-
79
-
80
-
81
-
82
-
83
-
84
-
85
-
86
-
87
-
88
-
89
-
90
-
91
-
92
-
93
-
94
-
95
-
96
-
97
-
98
-
99
-
100
-
101
-
102
-
103
-
104
-
105
-
106
-
107
-
108
-
109
-
110
-
111
-
112
-
113
-
114
-
115
-
116
-
117
-
118
-
119
-
120
-
121
-
122
-
123
-
124
-
125
-
126
-
127
-
128
-
129
-
130
-
131
-
132
-
133
-
134
-
135
-
136
-
137
-
138
-
139
-
140
-
141
-
142
-
143
-
144
-
145
-
146
-
147
-
148
-
149
-
150
-
151
-
152
-
153
-
154
-
155
-
156
-
157
-
158
-
159
-
160
-
161
-
162
-
163
-
164
-
165
-
166
-
167
-
168
-
169
-
170
-
171
-
172
-
173
-
174
-
175
-
176
-
177
-
178
-
179
-
180
-
181
-
182
-
183
-
184
-
185
-
186
-
187
-
188
-
189
-
190
-
191
-
192
-
193
-
194
-
195
-
196
-
197
-
198
-
199
-
200
-
201
-
202
-
203
-
204
-
205
-
206
-
207
-
208
-
209
-
210
-
211
-
212
-
213
-
214
-
215
-
216
-
217
-
218
-
219
-
220
-
221
-
222
-
223
-
224
-
225
-
226
-
227
-
228
-
229
-
230
-
231
-
232
-
233
-
234
-
235
-
236
-
237
-
238
-
239
-
240
-
241
-
242
-
243
-
244
-
245
-
246
-
247
-
248
-
249
-
250
-
251
-
252
-
253
-
254
-
255
-
256
-
257
-
258
-
259
-
260
-
261
-
262
-
263
-
264
-
265
-
266
-
267
-
268
-
269
-
270
-
271
-
272
-
273
-
274
-
275
-
276
-
277
-
278
-
279
-
280
-
281
-
282
-
283
-
284
-
285
-
286
-
287
-
288
-
289
-
290
-
291
-
292
 |
 |

4 2010 ANNUAL REPORT
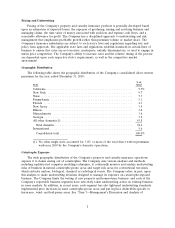
business — the health of the economy, the investment environment and pricing in the
insurance marketplace — will return to more normal levels by historical standards. In
any event, given our competitive advantages, we are committed to generating top-tier
performance in whatever market conditions we face.
Focus on customer retention and new business
In our insurance business, we have leveraged our franchise strength and size and our
related data advantage together with our highly sophisticated analytics to generate
attractive business opportunities.
• Business Insurance — In our largest business segment, we are extremely well
positioned for an improved economic environment through several competitive
advantages. First, our extensive product breadth allows us to respond to our agents’
and policyholders’ needs, and this advantage is enhanced when combined with the
depth and strength of our distributor relationships. Second, we are applying signifi cant
customer-focused solutions to each business area. For example, in Commercial
Accounts, we continue to expand our specialized IndustryEdge
®
suite of products
and services to address the unique needs of the industries we serve. This expansion
contributed to account growth within Commercial Accounts of approximately
4 percent for the year. In Select Accounts, our small commercial business, we have
addressed the needs of agents and brokers who handle this high volume business
through the easy-to-access, user-friendly technology of our TravelersExpress
®
quote-to-issue process. This technology contributed to 2010 account growth in Select
Accounts of approximately 8 percent at a time when the small business market overall
declined due to the challenging economic environment. And in National Accounts, we
meet the needs of our largest customers by offering fl exible program design and risk
management services to better manage their total cost of risk.
• Financial, Professional & International Insurance — Bond & Financial Products,
which comprises the surety and management liability businesses, benefi ts from
a long-standing commitment to these markets and differentiates its approach
by offering value-added services. For example, we offer a benchmarking analysis
to our construction surety clients to provide valuable insights on their business
performance based on our industry-leading database. Also, our management
liability modular policy suites provide options for coverage enhancements as a
business or organization grows. In our International operations, we are leveraging
expertise from across the company to deliver a greater breadth of products,
specialized underwriting, enhanced claim and risk control services, as well as
superior execution through the use of analytics. We are especially pleased with
our recently announced joint venture with J. Malucelli Participações em Seguros e
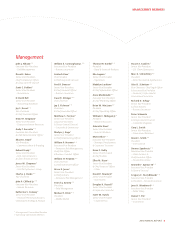
Travelers began using the
iconic red umbrella in the
company’s logo in 1960.
In 2010, red umbrellas adorn
a skyway that connects two
of the company’s multiple
buildings in downtown
Hartford, Connecticut.
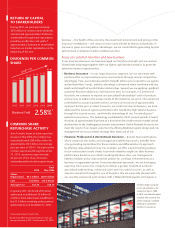
1 Compound Annual Growth Rate
2
Based on 4Q 2010 dividend of $0.36 per share and
closing share price of $55.71 on December 31, 2010.
RETURN OF CAPITAL
TO SHAREHOLDERS
During 2010, we paid approximately
$670 million in common share dividends
and returned approximately $5 billion to
shareholders through share repurchases,
providing an effective cash yield of
approximately 22 percent to shareholders
based on our market capitalization at the
beginning of the year.
DIVIDENDS PER COMMON
SHARE
COMMON SHARE
REPURCHASE ACTIVITY
Since Travelers began its share repurchase
program in May 2006, the company has
repurchased nearly 289 million shares for
approximately $14.5 billion at an average
price per share of $50.15. The total number
of shares repurchased through December
31, 2010, represents approximately
42 percent of the shares that were
outstanding at the time the program began.
In January 2011, the Board of Directors
authorized an additional $5 billion of
common share repurchases in addition to
the $1.5 billion remaining under previous
authorizations as of December 31, 2010.
201020092008200720062005
$1.41
$1.23
$1.19
$1.13
$1.01
$.91
Dividend Yield
CAGR
1
+9%
2.58%2
2010
Since
May 2006
Shares
Repurchased 95.7 million 288.9 million
Cost $5 billion $14.5 billion
Average Price $52.24 $50.15