Travelers 2010 Annual Report Download - page 168
Download and view the complete annual report
Please find page 168 of the 2010 Travelers annual report below. You can navigate through the pages in the report by either clicking on the pages listed below, or by using the keyword search tool below to find specific information within the annual report.-
 1
1 -
2
-
3
-
4
-
5
-
6
-
7
-
8
-
9
-
10
-
11
-
12
-
13
-
14
-
15
-
16
-
17
-
18
-
19
-
20
-
21
-
22
-
23
-
24
-
25
-
26
-
27
-
28
-
29
-
30
-
31
-
32
-
33
-
34
-
35
-
36
-
37
-
38
-
39
-
40
-
41
-
42
-
43
-
44
-
45
-
46
-
47
-
48
-
49
-
50
-
51
-
52
-
53
-
54
-
55
-
56
-
57
-
58
-
59
-
60
-
61
-
62
-
63
-
64
-
65
-
66
-
67
-
68
-
69
-
70
-
71
-
72
-
73
-
74
-
75
-
76
-
77
-
78
-
79
-
80
-
81
-
82
-
83
-
84
-
85
-
86
-
87
-
88
-
89
-
90
-
91
-
92
-
93
-
94
-
95
-
96
-
97
-
98
-
99
-
100
-
101
-
102
-
103
-
104
-
105
-
106
-
107
-
108
-
109
-
110
-
111
-
112
-
113
-
114
-
115
-
116
-
117
-
118
-
119
-
120
-
121
-
122
-
123
-
124
-
125
-
126
-
127
-
128
-
129
-
130
-
131
-
132
-
133
-
134
-
135
-
136
-
137
-
138
-
139
-
140
-
141
-
142
-
143
-
144
-
145
-
146
-
147
-
148
-
149
-
150
-
151
-
152
-
153
-
154
-
155
-
156
-
157
-
 158
158 -
 159
159 -
 160
160 -
 161
161 -
 162
162 -
 163
163 -
 164
164 -
 165
165 -
 166
166 -
 167
167 -
 168
168 -
 169
169 -
 170
170 -
 171
171 -
 172
172 -
 173
173 -
 174
174 -
 175
175 -
 176
176 -
 177
177 -
 178
178 -
179
-
180
-
181
-
182
-
183
-
184
-
185
-
186
-
187
-
188
-
189
-
190
-
191
-
192
-
193
-
194
-
195
-
196
-
197
-
198
-
199
-
200
-
201
-
202
-
203
-
204
-
205
-
206
-
207
-
208
-
209
-
210
-
211
-
212
-
213
-
214
-
215
-
216
-
217
-
218
-
219
-
220
-
221
-
222
-
223
-
224
-
225
-
226
-
227
-
228
-
229
-
230
-
231
-
232
-
233
-
234
-
235
-
236
-
237
-
238
-
239
-
240
-
241
-
242
-
243
-
244
-
245
-
246
-
247
-
248
-
249
-
250
-
251
-
252
-
253
-
254
-
255
-
256
-
257
-
258
-
259
-
260
-
261
-
262
-
263
-
264
-
265
-
266
-
267
-
268
-
269
-
270
-
271
-
272
-
273
-
274
-
275
-
276
-
277
-
278
-
279
-
280
-
281
-
282
-
283
-
284
-
285
-
286
-
287
-
288
-
289
-
290
-
291
-
292
 |
 |

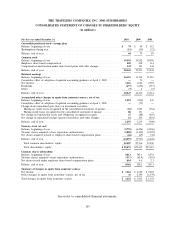
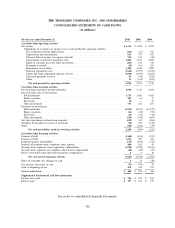
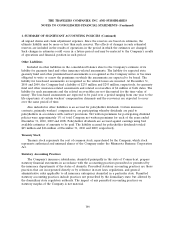
THE TRAVELERS COMPANIES, INC. AND SUBSIDIARIES
CONSOLIDATED STATEMENT OF CASH FLOWS
(in millions)
For the year ended December 31, 2010 2009 2008
Cash flows from operating activities
Net income ...................................................... $ 3,216 $ 3,622 $ 2,924
Adjustments to reconcile net income to net cash provided by operating activities:
Net realized investment (gains) losses ................................... (264) (17) 415
Depreciation and amortization ....................................... 812 797 821
Deferred federal income tax expense (benefit) ............................. 178 213 (58)
Amortization of deferred acquisition costs ................................ 3,802 3,813 3,880
Equity in (income) loss from other investments ............................. (283) 126 312
Premiums receivable .............................................. (29) 364 285
Reinsurance recoverables ........................................... 1,300 1,416 1,209
Deferred acquisition costs .......................................... (3,826) (3,797) (3,845)
Claims and claim adjustment expense reserves ............................. (1,968) (1,596) (2,033)
Unearned premium reserves ......................................... 63 (96) (270)
Other ....................................................... 53 (614) (502)
Net cash provided by operating activities ............................... 3,054 4,231 3,138
Cash flows from investing activities
Proceeds from maturities of fixed maturities .................................. 5,896 5,316 4,869
Proceeds from sales of investments:
Fixed maturities .................................................. 3,713 2,805 6,932
Equity securities .................................................. 201 65 53
Real estate ..................................................... 10 —25
Other investments ................................................. 717 511 655
Purchases of investments:
Fixed maturities .................................................. (6,785) (9,647) (11,127)
Equity securities .................................................. (61) (24) (95)
Real estate ..................................................... (21) (15) (38)
Other investments ................................................. (514) (349) (667)
Net sales (purchases) of short-term securities ................................. (699) 370 (406)
Securities transactions in course of settlement ................................. (30) 395 (318)
Other .......................................................... (318) (326) (45)
Net cash provided by (used in) investing activities ......................... 2,109 (899) (162)
Cash flows from financing activities
Payment of debt ................................................... (1,160) (143) (552)
Issuance of debt ................................................... 1,234 494 496
Dividends paid to shareholders .......................................... (673) (693) (715)
Issuance of common stock—employee share options ............................. 408 180 89
Treasury stock acquired—share repurchase authorization .......................... (4,998) (3,259) (2,167)
Treasury stock acquired—net employee share-based compensation .................... (40) (29) (29)
Excess tax benefits from share-based payment arrangements ........................ 8810
Net cash used in financing activities .................................. (5,221) (3,442) (2,868)
Effect of exchange rate changes on cash .................................... 315 (29)
Net increase (decrease) in cash .......................................... (55) (95) 79
Cash at beginning of year ............................................. 255 350 271
Cash at end of year ................................................. $ 200 $ 255 $ 350
Supplemental disclosure of cash flow information
Income taxes paid .................................................. $ 784 $ 876 $ 841
Interest paid ...................................................... $ 397 $ 385 $ 375
See notes to consolidated financial statements.
156