Travelers 2010 Annual Report Download - page 94
Download and view the complete annual report
Please find page 94 of the 2010 Travelers annual report below. You can navigate through the pages in the report by either clicking on the pages listed below, or by using the keyword search tool below to find specific information within the annual report.-
 1
1 -
2
-
3
-
4
-
5
-
6
-
7
-
8
-
9
-
10
-
11
-
12
-
13
-
14
-
15
-
16
-
17
-
18
-
19
-
20
-
21
-
22
-
23
-
24
-
25
-
26
-
27
-
28
-
29
-
30
-
31
-
32
-
33
-
34
-
35
-
36
-
37
-
38
-
39
-
40
-
41
-
42
-
43
-
44
-
45
-
46
-
47
-
48
-
49
-
50
-
51
-
52
-
53
-
54
-
55
-
56
-
57
-
58
-
59
-
60
-
61
-
62
-
63
-
64
-
65
-
66
-
67
-
68
-
69
-
70
-
71
-
72
-
73
-
74
-
75
-
76
-
77
-
78
-
79
-
80
-
81
-
82
-
83
-
 84
84 -
 85
85 -
 86
86 -
 87
87 -
 88
88 -
 89
89 -
 90
90 -
 91
91 -
 92
92 -
 93
93 -
 94
94 -
 95
95 -
 96
96 -
 97
97 -
 98
98 -
 99
99 -
 100
100 -
 101
101 -
 102
102 -
 103
103 -
 104
104 -
105
-
106
-
107
-
108
-
109
-
110
-
111
-
112
-
113
-
114
-
115
-
116
-
117
-
118
-
119
-
120
-
121
-
122
-
123
-
124
-
125
-
126
-
127
-
128
-
129
-
130
-
131
-
132
-
133
-
134
-
135
-
136
-
137
-
138
-
139
-
140
-
141
-
142
-
143
-
144
-
145
-
146
-
147
-
148
-
149
-
150
-
151
-
152
-
153
-
154
-
155
-
156
-
157
-
158
-
159
-
160
-
161
-
162
-
163
-
164
-
165
-
166
-
167
-
168
-
169
-
170
-
171
-
172
-
173
-
174
-
175
-
176
-
177
-
178
-
179
-
180
-
181
-
182
-
183
-
184
-
185
-
186
-
187
-
188
-
189
-
190
-
191
-
192
-
193
-
194
-
195
-
196
-
197
-
198
-
199
-
200
-
201
-
202
-
203
-
204
-
205
-
206
-
207
-
208
-
209
-
210
-
211
-
212
-
213
-
214
-
215
-
216
-
217
-
218
-
219
-
220
-
221
-
222
-
223
-
224
-
225
-
226
-
227
-
228
-
229
-
230
-
231
-
232
-
233
-
234
-
235
-
236
-
237
-
238
-
239
-
240
-
241
-
242
-
243
-
244
-
245
-
246
-
247
-
248
-
249
-
250
-
251
-
252
-
253
-
254
-
255
-
256
-
257
-
258
-
259
-
260
-
261
-
262
-
263
-
264
-
265
-
266
-
267
-
268
-
269
-
270
-
271
-
272
-
273
-
274
-
275
-
276
-
277
-
278
-
279
-
280
-
281
-
282
-
283
-
284
-
285
-
286
-
287
-
288
-
289
-
290
-
291
-
292
 |
 |
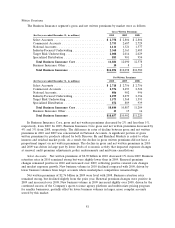
Commercial Accounts. Net written premiums of $2.58 billion in 2010 were 3% higher than in
2009. Business retention rates in 2010 remained strong and increased slightly over 2009. Renewal
premium changes in 2010 were slightly positive, as positive renewal rate changes were largely offset by
a modest decline in exposures that reflected the impact of general economic conditions. New business
levels also increased over 2009.
In 2009, net written premiums of $2.49 billion were 1% lower than in 2008. Business retention
rates in 2009 remained strong but declined slightly from the prior year. Renewal premium changes were
slightly negative in 2009 but were improved over 2008, as the impact of a continued improving rate
trend was partially offset by the impact of general economic conditions. New business levels increased
when compared with 2008 due to various product and customer initiatives.
National Accounts. Net written premiums of $806 million in 2010 were 11% lower than in 2009,
reflecting reduced insurance exposures driven by lower levels of economic activity, less prior year
retrospective premium adjustments and the loss of a large account. Despite the loss of that account,
business retention rates remained high in 2010.
In 2009, net written premiums of $902 million were 9% lower than in 2008, driven by the loss of a
large account, negative renewal premium changes that reflected the impact of general economic
conditions, and lower premium volume from property and workers’ compensation involuntary residual
markets. Despite the impact of the loss of a large account, business retention rates remained high in
2009.
Industry-Focused Underwriting. Net written premiums of $2.30 billion in 2010 increased 1% over
2009. Premium growth in 2010 was concentrated in the Technology, Agribusiness and Oil & Gas
business units. In the Technology business unit, the 3% growth in net written premiums over 2009
reflected continued strong business retention rates and new business levels. In the Agribusiness business
unit, the 5% growth in net written premiums was primarily driven by an increase in renewal premium
changes and strong business retention rates. In the Oil & Gas business unit, net written premiums
increased by 3% over 2009, primarily reflecting a decline in ceded premiums.
In 2009, net written premiums of $2.28 billion declined 5% from 2008. Premium declines were
concentrated in the Construction and Oil & Gas business units, reflecting the impact of general
economic conditions in these industries. In addition, premium volume in the Technology and Public
Sector business units declined, reflecting the impact of general economic conditions and competitive
market pressures. These declines were partially offset by premium growth in the Agribusiness business
unit in 2009.
Target Risk Underwriting. Net written premiums of $1.57 billion in 2010 were slightly higher than
in 2009. Premium growth in the Boiler & Machinery and Inland Marine business units was driven by
increases in new business volume coupled with increases in business retention rates. Growth in these
business units was largely offset by a decline in National Property premium volume, driven by
reductions in renewal premium changes and new business levels.
In 2009, net written premiums of $1.57 billion were 2% lower than in 2008, primarily due to the
Inland Marine and Ocean Marine business units, reflecting the impact of general economic conditions
and a decline in new business volume. Partially offsetting the declines in these business units was strong
growth in National Property premium volume in 2009 due to significant increases in renewal premium
changes. Excess Casualty written premiums also increased over 2008, due to a change in the terms of
certain reinsurance treaties that resulted in a higher level of business retained.
Specialized Distribution. Net written premiums of $872 million in 2010 were 2% lower than in
2009, primarily driven by negative renewal premium changes in both the Northland and National
Programs business units. Business retention rates in both business units increased over 2009.
82