Travelers 2010 Annual Report Download - page 82
Download and view the complete annual report
Please find page 82 of the 2010 Travelers annual report below. You can navigate through the pages in the report by either clicking on the pages listed below, or by using the keyword search tool below to find specific information within the annual report.-
 1
1 -
2
-
3
-
4
-
5
-
6
-
7
-
8
-
9
-
10
-
11
-
12
-
13
-
14
-
15
-
16
-
17
-
18
-
19
-
20
-
21
-
22
-
23
-
24
-
25
-
26
-
27
-
28
-
29
-
30
-
31
-
32
-
33
-
34
-
35
-
36
-
37
-
38
-
39
-
40
-
41
-
42
-
43
-
44
-
45
-
46
-
47
-
48
-
49
-
50
-
51
-
52
-
53
-
54
-
55
-
56
-
57
-
58
-
59
-
60
-
61
-
62
-
63
-
64
-
65
-
66
-
67
-
68
-
69
-
70
-
71
-
 72
72 -
 73
73 -
 74
74 -
 75
75 -
 76
76 -
 77
77 -
 78
78 -
 79
79 -
 80
80 -
 81
81 -
 82
82 -
 83
83 -
 84
84 -
 85
85 -
 86
86 -
 87
87 -
 88
88 -
 89
89 -
 90
90 -
 91
91 -
 92
92 -
93
-
94
-
95
-
96
-
97
-
98
-
99
-
100
-
101
-
102
-
103
-
104
-
105
-
106
-
107
-
108
-
109
-
110
-
111
-
112
-
113
-
114
-
115
-
116
-
117
-
118
-
119
-
120
-
121
-
122
-
123
-
124
-
125
-
126
-
127
-
128
-
129
-
130
-
131
-
132
-
133
-
134
-
135
-
136
-
137
-
138
-
139
-
140
-
141
-
142
-
143
-
144
-
145
-
146
-
147
-
148
-
149
-
150
-
151
-
152
-
153
-
154
-
155
-
156
-
157
-
158
-
159
-
160
-
161
-
162
-
163
-
164
-
165
-
166
-
167
-
168
-
169
-
170
-
171
-
172
-
173
-
174
-
175
-
176
-
177
-
178
-
179
-
180
-
181
-
182
-
183
-
184
-
185
-
186
-
187
-
188
-
189
-
190
-
191
-
192
-
193
-
194
-
195
-
196
-
197
-
198
-
199
-
200
-
201
-
202
-
203
-
204
-
205
-
206
-
207
-
208
-
209
-
210
-
211
-
212
-
213
-
214
-
215
-
216
-
217
-
218
-
219
-
220
-
221
-
222
-
223
-
224
-
225
-
226
-
227
-
228
-
229
-
230
-
231
-
232
-
233
-
234
-
235
-
236
-
237
-
238
-
239
-
240
-
241
-
242
-
243
-
244
-
245
-
246
-
247
-
248
-
249
-
250
-
251
-
252
-
253
-
254
-
255
-
256
-
257
-
258
-
259
-
260
-
261
-
262
-
263
-
264
-
265
-
266
-
267
-
268
-
269
-
270
-
271
-
272
-
273
-
274
-
275
-
276
-
277
-
278
-
279
-
280
-
281
-
282
-
283
-
284
-
285
-
286
-
287
-
288
-
289
-
290
-
291
-
292
 |
 |

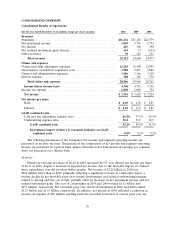
CONSOLIDATED OVERVIEW
Consolidated Results of Operations
(for the year ended December 31, in millions except per share amounts) 2010 2009 2008
Revenues
Premiums .............................................. $21,432 $21,418 $21,579
Net investment income ..................................... 3,059 2,776 2,792
Fee income ............................................. 287 306 390
Net realized investment gains (losses) .......................... 264 17 (415)
Other revenues .......................................... 70 163 131
Total revenues ........................................ 25,112 24,680 24,477
Claims and expenses
Claims and claim adjustment expenses .......................... 13,210 12,408 12,993
Amortization of deferred acquisition costs ....................... 3,802 3,813 3,880
General and administrative expenses ........................... 3,406 3,366 3,518
Interest expense .......................................... 388 382 370
Total claims and expenses ............................... 20,806 19,969 20,761
Income before income taxes ................................ 4,306 4,711 3,716
Income tax expense ....................................... 1,090 1,089 792
Net income ............................................ $ 3,216 $ 3,622 $ 2,924
Net income per share
Basic ................................................ $ 6.69 $ 6.38 $ 4.87
Diluted .............................................. $ 6.62 $ 6.33 $ 4.81
GAAP combined ratio
Loss and loss adjustment expense ratio ....................... 61.0% 57.3% 59.4%
Underwriting expense ratio ................................ 32.2 31.9 32.5
GAAP combined ratio ................................. 93.2% 89.2% 91.9%
Incremental impact of direct to consumer initiative on GAAP
combined ratio .................................... 0.8% 0.5% 0.2%
The following discussions of the Company’s net income and segment operating income are
presented on an after-tax basis. Discussions of the components of net income and segment operating
income are presented on a pretax basis, unless otherwise noted. Discussions of earnings per common
share are presented on a diluted basis.
Overview
Diluted net income per share of $6.62 in 2010 increased by 5% over diluted net income per share
of $6.33 in 2009, despite a decrease in reported net income, due to the favorable impact of common
share repurchases over the previous twelve months. Net income of $3.22 billion in 2010 was
$406 million lower than in 2009, primarily reflecting a significant increase in catastrophe losses, a
modest decline in net favorable prior year reserve development and reduced underwriting margins
related to pricing and loss cost trends, partially offset by increases in net investment income and net
realized investment gains. The cost of catastrophes in 2010 and 2009 totaled $1.11 billion and
$457 million, respectively. Net favorable prior year reserve development in 2010 and 2009 totaled
$1.25 billion and $1.33 billion, respectively. In addition, net income in 2009 reflected a reduction in
income tax expense of $89 million resulting from the favorable resolution of various prior year tax
70