Travelers 2010 Annual Report Download - page 93
Download and view the complete annual report
Please find page 93 of the 2010 Travelers annual report below. You can navigate through the pages in the report by either clicking on the pages listed below, or by using the keyword search tool below to find specific information within the annual report.-
 1
1 -
2
-
3
-
4
-
5
-
6
-
7
-
8
-
9
-
10
-
11
-
12
-
13
-
14
-
15
-
16
-
17
-
18
-
19
-
20
-
21
-
22
-
23
-
24
-
25
-
26
-
27
-
28
-
29
-
30
-
31
-
32
-
33
-
34
-
35
-
36
-
37
-
38
-
39
-
40
-
41
-
42
-
43
-
44
-
45
-
46
-
47
-
48
-
49
-
50
-
51
-
52
-
53
-
54
-
55
-
56
-
57
-
58
-
59
-
60
-
61
-
62
-
63
-
64
-
65
-
66
-
67
-
68
-
69
-
70
-
71
-
72
-
73
-
74
-
75
-
76
-
77
-
78
-
79
-
80
-
81
-
82
-
 83
83 -
 84
84 -
 85
85 -
 86
86 -
 87
87 -
 88
88 -
 89
89 -
 90
90 -
 91
91 -
 92
92 -
 93
93 -
 94
94 -
 95
95 -
 96
96 -
 97
97 -
 98
98 -
 99
99 -
 100
100 -
 101
101 -
 102
102 -
 103
103 -
104
-
105
-
106
-
107
-
108
-
109
-
110
-
111
-
112
-
113
-
114
-
115
-
116
-
117
-
118
-
119
-
120
-
121
-
122
-
123
-
124
-
125
-
126
-
127
-
128
-
129
-
130
-
131
-
132
-
133
-
134
-
135
-
136
-
137
-
138
-
139
-
140
-
141
-
142
-
143
-
144
-
145
-
146
-
147
-
148
-
149
-
150
-
151
-
152
-
153
-
154
-
155
-
156
-
157
-
158
-
159
-
160
-
161
-
162
-
163
-
164
-
165
-
166
-
167
-
168
-
169
-
170
-
171
-
172
-
173
-
174
-
175
-
176
-
177
-
178
-
179
-
180
-
181
-
182
-
183
-
184
-
185
-
186
-
187
-
188
-
189
-
190
-
191
-
192
-
193
-
194
-
195
-
196
-
197
-
198
-
199
-
200
-
201
-
202
-
203
-
204
-
205
-
206
-
207
-
208
-
209
-
210
-
211
-
212
-
213
-
214
-
215
-
216
-
217
-
218
-
219
-
220
-
221
-
222
-
223
-
224
-
225
-
226
-
227
-
228
-
229
-
230
-
231
-
232
-
233
-
234
-
235
-
236
-
237
-
238
-
239
-
240
-
241
-
242
-
243
-
244
-
245
-
246
-
247
-
248
-
249
-
250
-
251
-
252
-
253
-
254
-
255
-
256
-
257
-
258
-
259
-
260
-
261
-
262
-
263
-
264
-
265
-
266
-
267
-
268
-
269
-
270
-
271
-
272
-
273
-
274
-
275
-
276
-
277
-
278
-
279
-
280
-
281
-
282
-
283
-
284
-
285
-
286
-
287
-
288
-
289
-
290
-
291
-
292
 |
 |

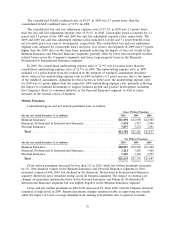
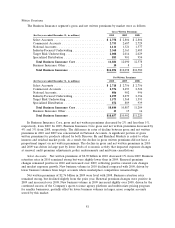
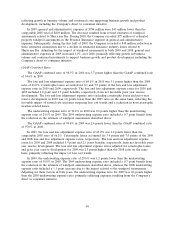
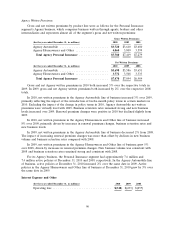
Written Premiums
The Business Insurance segment’s gross and net written premiums by market were as follows:
Gross Written Premiums
(for the year ended December 31, in millions) 2010 2009 2008
Select Accounts ............................. $ 2,758 $ 2,804 $ 2,804
Commercial Accounts ........................ 2,753 2,687 2,729
National Accounts ........................... 1,111 1,321 1,577
Industry-Focused Underwriting .................. 2,368 2,363 2,485
Target Risk Underwriting ...................... 2,008 2,014 2,029
Specialized Distribution ....................... 883 901 954
Total Business Insurance Core ................ 11,881 12,090 12,578
Business Insurance Other ...................... 10 82
Total Business Insurance .................... $11,891 $12,098 $12,580
Net Written Premiums
(for the year ended December 31, in millions) 2010 2009 2008
Select Accounts ............................. $ 2,718 $ 2,756 $ 2,756
Commercial Accounts ........................ 2,576 2,493 2,524
National Accounts ........................... 806 902 996
Industry-Focused Underwriting .................. 2,299 2,279 2,396
Target Risk Underwriting ...................... 1,573 1,568 1,593
Specialized Distribution ....................... 872 889 939
Total Business Insurance Core ................ 10,844 10,887 11,204
Business Insurance Other ...................... 13 15 16
Total Business Insurance .................... $10,857 $10,902 $11,220
In Business Insurance Core, gross and net written premiums decreased by 2% and less than 1%,
respectively, from 2009. In 2009, Business Insurance Core gross and net written premiums decreased by
4% and 3% from 2008, respectively. The difference in rates of decline between gross and net written
premiums in 2010 and 2009 was concentrated in National Accounts. A significant portion of gross
written premiums for products offered by both Discover Re and Residual Markets is ceded to other
insurers and residual market pools. As a result, the decline in gross written premiums did not have a
proportional impact on net written premiums. The decline in gross and net written premiums in 2010
and 2009 was driven in large part by lower levels of economic activity that impacted exposure changes
at renewal, audit premium adjustments, policy endorsements and mid-term cancellations.
Select Accounts. Net written premiums of $2.72 billion in 2010 decreased 1% from 2009. Business
retention rates in 2010 remained strong but were slightly lower than in 2009. Renewal premium
changes remained positive in 2010 and increased over 2009, reflecting positive renewal rate changes
and modest exposure growth. New business volume in 2010 declined compared with 2009, driven by
lower business volumes from larger accounts where marketplace competition remained high.
Net written premiums of $2.76 billion in 2009 were level with 2008. Business retention rates
remained strong, but declined slightly from the prior year. Renewal premium changes were positive in
2009 and increased over 2008. New business volume in 2009 increased slightly over 2008, driven by the
continued success of the Company’s quote-to-issue agency platform and multivariate pricing program
for smaller businesses, partially offset by lower business volumes in larger, more complex accounts
served by this market.
81