Travelers 2010 Annual Report Download - page 83
Download and view the complete annual report
Please find page 83 of the 2010 Travelers annual report below. You can navigate through the pages in the report by either clicking on the pages listed below, or by using the keyword search tool below to find specific information within the annual report.-
 1
1 -
2
-
3
-
4
-
5
-
6
-
7
-
8
-
9
-
10
-
11
-
12
-
13
-
14
-
15
-
16
-
17
-
18
-
19
-
20
-
21
-
22
-
23
-
24
-
25
-
26
-
27
-
28
-
29
-
30
-
31
-
32
-
33
-
34
-
35
-
36
-
37
-
38
-
39
-
40
-
41
-
42
-
43
-
44
-
45
-
46
-
47
-
48
-
49
-
50
-
51
-
52
-
53
-
54
-
55
-
56
-
57
-
58
-
59
-
60
-
61
-
62
-
63
-
64
-
65
-
66
-
67
-
68
-
69
-
70
-
71
-
72
-
 73
73 -
 74
74 -
 75
75 -
 76
76 -
 77
77 -
 78
78 -
 79
79 -
 80
80 -
 81
81 -
 82
82 -
 83
83 -
 84
84 -
 85
85 -
 86
86 -
 87
87 -
 88
88 -
 89
89 -
 90
90 -
 91
91 -
 92
92 -
 93
93 -
94
-
95
-
96
-
97
-
98
-
99
-
100
-
101
-
102
-
103
-
104
-
105
-
106
-
107
-
108
-
109
-
110
-
111
-
112
-
113
-
114
-
115
-
116
-
117
-
118
-
119
-
120
-
121
-
122
-
123
-
124
-
125
-
126
-
127
-
128
-
129
-
130
-
131
-
132
-
133
-
134
-
135
-
136
-
137
-
138
-
139
-
140
-
141
-
142
-
143
-
144
-
145
-
146
-
147
-
148
-
149
-
150
-
151
-
152
-
153
-
154
-
155
-
156
-
157
-
158
-
159
-
160
-
161
-
162
-
163
-
164
-
165
-
166
-
167
-
168
-
169
-
170
-
171
-
172
-
173
-
174
-
175
-
176
-
177
-
178
-
179
-
180
-
181
-
182
-
183
-
184
-
185
-
186
-
187
-
188
-
189
-
190
-
191
-
192
-
193
-
194
-
195
-
196
-
197
-
198
-
199
-
200
-
201
-
202
-
203
-
204
-
205
-
206
-
207
-
208
-
209
-
210
-
211
-
212
-
213
-
214
-
215
-
216
-
217
-
218
-
219
-
220
-
221
-
222
-
223
-
224
-
225
-
226
-
227
-
228
-
229
-
230
-
231
-
232
-
233
-
234
-
235
-
236
-
237
-
238
-
239
-
240
-
241
-
242
-
243
-
244
-
245
-
246
-
247
-
248
-
249
-
250
-
251
-
252
-
253
-
254
-
255
-
256
-
257
-
258
-
259
-
260
-
261
-
262
-
263
-
264
-
265
-
266
-
267
-
268
-
269
-
270
-
271
-
272
-
273
-
274
-
275
-
276
-
277
-
278
-
279
-
280
-
281
-
282
-
283
-
284
-
285
-
286
-
287
-
288
-
289
-
290
-
291
-
292
 |
 |

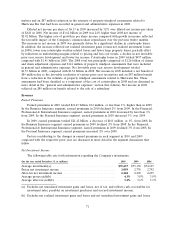
matters and an $87 million reduction in the estimate of property windpool assessments related to
Hurricane Ike that had been recorded in general and administrative expenses in 2008.
Diluted net income per share of $6.33 in 2009 increased by 32% over diluted net income per share
of $4.81 in 2008. Net income of $3.62 billion in 2009 was 24% higher than 2008 net income of
$2.92 billion. The higher rate of growth in per share income compared with growth in income reflected
the favorable impact of the Company’s common share repurchases over the previous twelve months.
The increase in net income in 2009 was primarily driven by a significant decline in catastrophe losses.
In addition, the increase reflected net realized investment gains (versus net realized investment losses
in 2008), lower non-catastrophe weather-related losses and fewer large property losses, partially offset
by reductions in underwriting margins related to pricing and loss cost trends, a decline in net favorable
prior year reserve development and lower fee income. Catastrophe losses in 2009 totaled $457 million,
compared with $1.41 billion in 2008. The 2008 total was principally comprised of $1.26 billion of claims
and claim adjustment expenses and $141 million of property windpool assessments that were included
in general and administrative expenses. Net favorable prior year reserve development totaled
$1.33 billion in 2009, compared with $1.54 billion in 2008. Net income in 2009 included a net benefit of
$89 million due to the favorable resolution of various prior year tax matters and an $87 million benefit
from a reduction in the estimate of property windpool assessments related to Hurricane Ike. These
assessments had been classified as a component of the cost of catastrophes in 2008 and are discussed in
more detail in the ‘‘general and administrative expenses’’ section that follows). Net income in 2008
reflected an $89 million tax benefit related to the sale of a subsidiary.
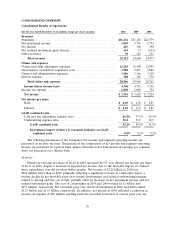
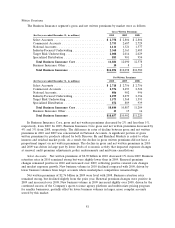
Revenues
Earned Premiums
Earned premiums in 2010 totaled $21.43 billion, $14 million, or less than 1%, higher than in 2009.
In the Business Insurance segment, earned premiums in 2010 declined 2% from 2009. In the Financial,
Professional & International Insurance segment, earned premiums in 2010 decreased by less than 1%
from 2009. In the Personal Insurance segment, earned premiums in 2010 increased 3% over 2009.
In 2009, earned premiums totaled $21.42 billion, a decrease of $161 million, or 1%, from 2008. In
the Business Insurance segment, earned premiums in 2009 declined 2% from 2008. In the Financial,
Professional & International Insurance segment, earned premiums in 2009 declined 3% from 2008. In
the Personal Insurance segment, earned premiums increased 2% over 2008.
Factors contributing to the changes in earned premiums in each segment in 2010 and 2009
compared with the respective prior year are discussed in more detail in the segment discussions that
follow.
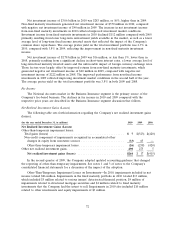
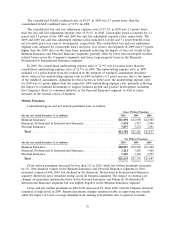
Net Investment Income
The following table sets forth information regarding the Company’s investments.
(for the year ended December 31, in millions) 2010 2009 2008
Average investments(a) ..................................... $71,637 $73,130 $74,197
Pretax net investment income ................................ 3,059 2,776 2,792
After-tax net investment income .............................. 2,468 2,290 2,299
Average pretax yield(b) .................................... 4.3% 3.8% 3.8%
Average after-tax yield(b) ................................... 3.4% 3.1% 3.1%
(a) Excludes net unrealized investment gains and losses, net of tax, and reflects cash, receivables for
investment sales, payables on investment purchases and accrued investment income.
(b) Excludes net realized investment gains and losses and net unrealized investment gains and losses.
71