Travelers 2010 Annual Report Download - page 276
Download and view the complete annual report
Please find page 276 of the 2010 Travelers annual report below. You can navigate through the pages in the report by either clicking on the pages listed below, or by using the keyword search tool below to find specific information within the annual report.-
 1
1 -
2
-
3
-
4
-
5
-
6
-
7
-
8
-
9
-
10
-
11
-
12
-
13
-
14
-
15
-
16
-
17
-
18
-
19
-
20
-
21
-
22
-
23
-
24
-
25
-
26
-
27
-
28
-
29
-
30
-
31
-
32
-
33
-
34
-
35
-
36
-
37
-
38
-
39
-
40
-
41
-
42
-
43
-
44
-
45
-
46
-
47
-
48
-
49
-
50
-
51
-
52
-
53
-
54
-
55
-
56
-
57
-
58
-
59
-
60
-
61
-
62
-
63
-
64
-
65
-
66
-
67
-
68
-
69
-
70
-
71
-
72
-
73
-
74
-
75
-
76
-
77
-
78
-
79
-
80
-
81
-
82
-
83
-
84
-
85
-
86
-
87
-
88
-
89
-
90
-
91
-
92
-
93
-
94
-
95
-
96
-
97
-
98
-
99
-
100
-
101
-
102
-
103
-
104
-
105
-
106
-
107
-
108
-
109
-
110
-
111
-
112
-
113
-
114
-
115
-
116
-
117
-
118
-
119
-
120
-
121
-
122
-
123
-
124
-
125
-
126
-
127
-
128
-
129
-
130
-
131
-
132
-
133
-
134
-
135
-
136
-
137
-
138
-
139
-
140
-
141
-
142
-
143
-
144
-
145
-
146
-
147
-
148
-
149
-
150
-
151
-
152
-
153
-
154
-
155
-
156
-
157
-
158
-
159
-
160
-
161
-
162
-
163
-
164
-
165
-
166
-
167
-
168
-
169
-
170
-
171
-
172
-
173
-
174
-
175
-
176
-
177
-
178
-
179
-
180
-
181
-
182
-
183
-
184
-
185
-
186
-
187
-
188
-
189
-
190
-
191
-
192
-
193
-
194
-
195
-
196
-
197
-
198
-
199
-
200
-
201
-
202
-
203
-
204
-
205
-
206
-
207
-
208
-
209
-
210
-
211
-
212
-
213
-
214
-
215
-
216
-
217
-
218
-
219
-
220
-
221
-
222
-
223
-
224
-
225
-
226
-
227
-
228
-
229
-
230
-
231
-
232
-
233
-
234
-
235
-
236
-
237
-
238
-
239
-
240
-
241
-
242
-
243
-
244
-
245
-
246
-
247
-
248
-
249
-
250
-
251
-
252
-
253
-
254
-
255
-
256
-
257
-
258
-
259
-
260
-
261
-
262
-
263
-
264
-
265
-
 266
266 -
 267
267 -
 268
268 -
 269
269 -
 270
270 -
 271
271 -
 272
272 -
 273
273 -
 274
274 -
 275
275 -
 276
276 -
 277
277 -
 278
278 -
 279
279 -
 280
280 -
 281
281 -
 282
282 -
 283
283 -
 284
284 -
 285
285 -
 286
286 -
287
-
288
-
289
-
290
-
291
-
292
 |
 |

264
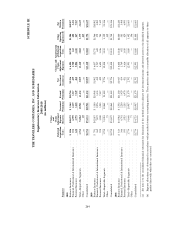
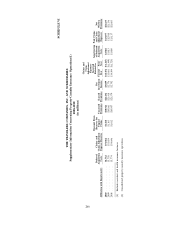
SCHEDULE III
THE TRAVELERS COMPANIES, INC. AND SUBSIDIARIES
Supplementary Insurance Information
2008-2010
(in millions)
Claims
and
Claim Claims and Amortization
Deferred Adjustment Net Claim of Deferred Other Net
Acquisition Expense Unearned Earned Investment Adjustment Acquisition Operating Written
Segment Costs Reserves Premiums Premiums Income(a) Expenses Costs Expenses(b) Premiums
2010
Business Insurance ........................ $ 806 $40,272 $ 5,364 $10,766 $2,156 $ 6,504 $1,749 $1,904 $10,857
Financial, Professional & International Insurance .... 352 6,999 2,139 3,317 439 1,700 612 608 3,211
Personal Insurance ........................ 624 3,791 3,418 7,349 464 5,006 1,441 867 7,567
Total—Reportable Segments .................. 1,782 51,062 10,921 21,432 3,059 13,210 3,802 3,379 21,635
Other ................................ — 69 — — — — — 415 —
Consolidated ........................... $1,782 $51,131 $10,921 $21,432 $3,059 $13,210 $3,802 $3,794 $21,635
2009
Business Insurance ........................ $ 791 $42,057 $ 5,380 $10,968 $1,902 $ 6,037 $1,775 $1,966 $10,902
Financial, Professional & International Insurance .... 369 7,197 2,276 3,333 452 1,747 622 579 3,285
Personal Insurance ........................ 598 3,800 3,205 7,117 422 4,624 1,416 784 7,149
Total—Reportable Segments .................. 1,758 53,054 10,861 21,418 2,776 12,408 3,813 3,329 21,336
Other ................................ — 73 — — — — — 419 —
Consolidated ........................... $1,758 $53,127 $10,861 $21,418 $2,776 $12,408 $3,813 $3,748 $21,336
2008
Business Insurance ........................ $ 813 $43,982 $ 5,552 $11,180 $1,917 $ 6,608 $1,818 $2,080 $11,220
Financial, Professional & International Insurance .... 366 6,741 2,250 3,429 454 1,769 652 583 3,468
Personal Insurance ........................ 595 3,923 3,155 6,970 421 4,616 1,410 829 6,995
Total—Reportable Segments .................. 1,774 54,646 10,957 21,579 2,792 12,993 3,880 3,492 21,683
Other ................................ — 77 — — — — — 396 —
Consolidated ........................... $1,774 $54,723 $10,957 $21,579 $2,792 $12,993 $3,880 $3,888 $21,683
(a) See note 2 to the consolidated financial statements for discussion of the method used to allocate net investment income and invested assets to the identified segments.
(b) Expense allocations are determined in accordance with prescribed statutory accounting practices. These practices make a reasonable allocation of all expenses to those
product lines with which they are associated.