Travelers 2009 Annual Report Download - page 98
Download and view the complete annual report
Please find page 98 of the 2009 Travelers annual report below. You can navigate through the pages in the report by either clicking on the pages listed below, or by using the keyword search tool below to find specific information within the annual report.-
 1
1 -
2
-
3
-
4
-
5
-
6
-
7
-
8
-
9
-
10
-
11
-
12
-
13
-
14
-
15
-
16
-
17
-
18
-
19
-
20
-
21
-
22
-
23
-
24
-
25
-
26
-
27
-
28
-
29
-
30
-
31
-
32
-
33
-
34
-
35
-
36
-
37
-
38
-
39
-
40
-
41
-
42
-
43
-
44
-
45
-
46
-
47
-
48
-
49
-
50
-
51
-
52
-
53
-
54
-
55
-
56
-
57
-
58
-
59
-
60
-
61
-
62
-
63
-
64
-
65
-
66
-
67
-
68
-
69
-
70
-
71
-
72
-
73
-
74
-
75
-
76
-
77
-
78
-
79
-
80
-
81
-
82
-
83
-
84
-
85
-
86
-
87
-
 88
88 -
 89
89 -
 90
90 -
 91
91 -
 92
92 -
 93
93 -
 94
94 -
 95
95 -
 96
96 -
 97
97 -
 98
98 -
 99
99 -
 100
100 -
 101
101 -
 102
102 -
 103
103 -
 104
104 -
 105
105 -
 106
106 -
 107
107 -
 108
108 -
109
-
110
-
111
-
112
-
113
-
114
-
115
-
116
-
117
-
118
-
119
-
120
-
121
-
122
-
123
-
124
-
125
-
126
-
127
-
128
-
129
-
130
-
131
-
132
-
133
-
134
-
135
-
136
-
137
-
138
-
139
-
140
-
141
-
142
-
143
-
144
-
145
-
146
-
147
-
148
-
149
-
150
-
151
-
152
-
153
-
154
-
155
-
156
-
157
-
158
-
159
-
160
-
161
-
162
-
163
-
164
-
165
-
166
-
167
-
168
-
169
-
170
-
171
-
172
-
173
-
174
-
175
-
176
-
177
-
178
-
179
-
180
-
181
-
182
-
183
-
184
-
185
-
186
-
187
-
188
-
189
-
190
-
191
-
192
-
193
-
194
-
195
-
196
-
197
-
198
-
199
-
200
-
201
-
202
-
203
-
204
-
205
-
206
-
207
-
208
-
209
-
210
-
211
-
212
-
213
-
214
-
215
-
216
-
217
-
218
-
219
-
220
-
221
-
222
-
223
-
224
-
225
-
226
-
227
-
228
-
229
-
230
-
231
-
232
-
233
-
234
-
235
-
236
-
237
-
238
-
239
-
240
-
241
-
242
-
243
-
244
-
245
-
246
-
247
-
248
-
249
-
250
-
251
-
252
-
253
-
254
-
255
-
256
-
257
-
258
-
259
-
260
-
261
-
262
-
263
-
264
-
265
-
266
-
267
-
268
-
269
-
270
-
271
-
272
-
273
-
274
-
275
-
276
-
277
-
278
-
279
-
280
-
281
-
282
-
283
-
284
-
285
-
286
-
287
-
288
-
289
-
290
-
291
-
292
-
293
-
294
-
295
 |
 |

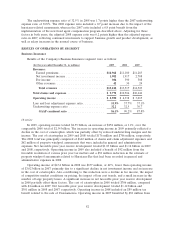
expense ratio for 2007, primarily reflecting continued investments to support business growth and
product development, the impact of a decline in the rate of earned premium growth relative to expense
growth, and declines in fee income.
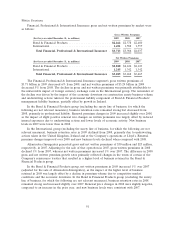
Written Premiums
The Business Insurance segment’s gross and net written premiums by market were as follows:
Gross Written Premiums
(for the year ended December 31, in millions) 2009 2008 2007
Select Accounts............................. $ 2,804 $ 2,804 $ 2,774
Commercial Accounts ........................ 2,687 2,729 2,740
National Accounts........................... 1,321 1,577 1,859
Industry-Focused Underwriting . . . . . . . . . . . . . . . . . . 2,363 2,485 2,380
Target Risk Underwriting . . . . . . . . . . . . . . . . . . . . . . 2,014 2,029 2,182
Specialized Distribution . . . . . . . . . . . . . . . . . . . . . . . 901 954 1,033
Total Business Insurance Core ................ 12,090 12,578 12,968
Business Insurance Other . . . . . . . . . . . . . . . . . . . . . . 8249
Total Business Insurance .................... $12,098 $12,580 $13,017
Net Written Premiums
(for the year ended December 31, in millions) 2009 2008 2007
Select Accounts............................. $ 2,756 $ 2,756 $ 2,711
Commercial Accounts ........................ 2,493 2,524 2,518
National Accounts........................... 902 996 1,056
Industry-Focused Underwriting . . . . . . . . . . . . . . . . . . 2,279 2,396 2,301
Target Risk Underwriting . . . . . . . . . . . . . . . . . . . . . . 1,568 1,593 1,665
Specialized Distribution . . . . . . . . . . . . . . . . . . . . . . . 889 939 1,015
Total Business Insurance Core ................ 10,887 11,204 11,266
Business Insurance Other . . . . . . . . . . . . . . . . . . . . . . 15 16 52
Total Business Insurance .................... $10,902 $11,220 $11,318
In Business Insurance Core, gross and net written premiums in 2009 decreased by 4% and 3%
from 2008, respectively. The decline in gross and net written premiums in 2009 was driven in large part
by lower levels of economic activity in recent quarters that impacted exposure changes at renewal, audit
premium adjustments, policy endorsements and mid-term cancellations.
In Business Insurance Core, gross and net written premiums in 2008 decreased by 3% and 1%
from 2007, respectively. The difference in rates of decline between gross and net written premiums in
2008 was concentrated in National Accounts, where a significant portion of gross written premiums is
ceded to other insurers and residual market pools. As a result, the decline in gross written premiums
did not have a proportional impact on net written premiums. Net written premium growth in the
Industry-Focused Underwriting, Select Accounts and Commercial Accounts groups generally reflected
higher business retention levels and new business volume in several business units within these groups.
This was more than offset by premium declines in Specialized Distribution, Target Risk Underwriting
and National Accounts.
Select Accounts. Net written premiums of $2.76 billion in 2009 were level with 2008. Business
retention rates remained strong, but declined slightly from the prior year. Renewal premium changes
were positive in 2009 and increased over 2008. New business volume in 2009 increased slightly over
86