Travelers 2009 Annual Report Download - page 134
Download and view the complete annual report
Please find page 134 of the 2009 Travelers annual report below. You can navigate through the pages in the report by either clicking on the pages listed below, or by using the keyword search tool below to find specific information within the annual report.-
 1
1 -
2
-
3
-
4
-
5
-
6
-
7
-
8
-
9
-
10
-
11
-
12
-
13
-
14
-
15
-
16
-
17
-
18
-
19
-
20
-
21
-
22
-
23
-
24
-
25
-
26
-
27
-
28
-
29
-
30
-
31
-
32
-
33
-
34
-
35
-
36
-
37
-
38
-
39
-
40
-
41
-
42
-
43
-
44
-
45
-
46
-
47
-
48
-
49
-
50
-
51
-
52
-
53
-
54
-
55
-
56
-
57
-
58
-
59
-
60
-
61
-
62
-
63
-
64
-
65
-
66
-
67
-
68
-
69
-
70
-
71
-
72
-
73
-
74
-
75
-
76
-
77
-
78
-
79
-
80
-
81
-
82
-
83
-
84
-
85
-
86
-
87
-
88
-
89
-
90
-
91
-
92
-
93
-
94
-
95
-
96
-
97
-
98
-
99
-
100
-
101
-
102
-
103
-
104
-
105
-
106
-
107
-
108
-
109
-
110
-
111
-
112
-
113
-
114
-
115
-
116
-
117
-
118
-
119
-
120
-
121
-
122
-
123
-
 124
124 -
 125
125 -
 126
126 -
 127
127 -
 128
128 -
 129
129 -
 130
130 -
 131
131 -
 132
132 -
 133
133 -
 134
134 -
 135
135 -
 136
136 -
 137
137 -
 138
138 -
 139
139 -
 140
140 -
 141
141 -
 142
142 -
 143
143 -
 144
144 -
145
-
146
-
147
-
148
-
149
-
150
-
151
-
152
-
153
-
154
-
155
-
156
-
157
-
158
-
159
-
160
-
161
-
162
-
163
-
164
-
165
-
166
-
167
-
168
-
169
-
170
-
171
-
172
-
173
-
174
-
175
-
176
-
177
-
178
-
179
-
180
-
181
-
182
-
183
-
184
-
185
-
186
-
187
-
188
-
189
-
190
-
191
-
192
-
193
-
194
-
195
-
196
-
197
-
198
-
199
-
200
-
201
-
202
-
203
-
204
-
205
-
206
-
207
-
208
-
209
-
210
-
211
-
212
-
213
-
214
-
215
-
216
-
217
-
218
-
219
-
220
-
221
-
222
-
223
-
224
-
225
-
226
-
227
-
228
-
229
-
230
-
231
-
232
-
233
-
234
-
235
-
236
-
237
-
238
-
239
-
240
-
241
-
242
-
243
-
244
-
245
-
246
-
247
-
248
-
249
-
250
-
251
-
252
-
253
-
254
-
255
-
256
-
257
-
258
-
259
-
260
-
261
-
262
-
263
-
264
-
265
-
266
-
267
-
268
-
269
-
270
-
271
-
272
-
273
-
274
-
275
-
276
-
277
-
278
-
279
-
280
-
281
-
282
-
283
-
284
-
285
-
286
-
287
-
288
-
289
-
290
-
291
-
292
-
293
-
294
-
295
 |
 |

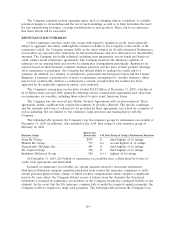
in the open market, pursuant to preset trading plans meeting the requirements of Rule 10b5-1 under
the Securities Exchange Act of 1934, in private transactions or otherwise. The authorizations do not
have a stated expiration date. The timing and actual number of shares to be repurchased in the future
will depend on a variety of factors, including the Company’s earnings, corporate and regulatory
requirements, share price, catastrophe losses, strategic initiatives and other market conditions. The
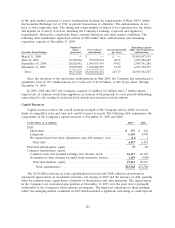
following table summarizes repurchase activity in 2009 under these authorizations and remaining
repurchase capacity at December 31, 2009.
Number of Remaining capacity
shares Cost of shares Average price paid under share repurchase
Quarterly Period Ending purchased repurchased per share authorization
March 31, 2009 . . . . . . . . . . . . . . — $ — $ — $3,809,857,539
June 30, 2009 . . . . . . . . . . . . . . . 18,450,066 750,030,914 40.65 3,059,826,625
September 30, 2009 . . . . . . . . . . . 20,826,981 1,000,035,439 48.02 2,059,791,186
December 31, 2009 . . . . . . . . . . . 30,095,982 1,550,088,479 51.50 6,509,702,707
Total . . . . . . . . . . . . . . . . . . . . 69,373,029 $3,300,154,832 $47.57 $6,509,702,707
Since the inception of the repurchase authorizations in May 2006, the Company has repurchased a
cumulative total of 193.2 million shares for a total cost of $9.49 billion, or $49.12 per share, through
December 31, 2009.
In 2009, 2008 and 2007, the Company acquired 1.5 million, 0.8 million and 1.7 million shares,
respectively, of common stock from employees as treasury stock primarily to cover payroll withholding
taxes related to the vesting of restricted stock awards and exercises of stock options.
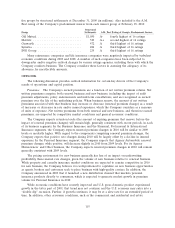
Capital Resources
Capital resources reflect the overall financial strength of the Company and its ability to borrow
funds at competitive rates and raise new capital to meet its needs. The following table summarizes the
components of the Company’s capital structure at December 31, 2009 and 2008.
(at December 31, in millions) 2009 2008
Debt:
Short-term............................................. $ 373 $ 242
Long-term............................................. 6,165 5,938
Net unamortized fair value adjustments and debt issuance costs . . . . . . (11) 1
Total debt............................................ 6,527 6,181
Preferred shareholders’ equity . . . . . . . . . . . . . . . . . . . . . . . . . . . . . . . . 79 89
Common shareholders’ equity:
Common stock and retained earnings, less treasury stock . . . . . . . . . . . 26,117 26,130
Accumulated other changes in equity from nonowner sources . . . . . . . . 1,219 (900)
Total shareholders’ equity ................................ 27,415 25,319
Total capitalization.................................... $33,942 $31,500
The $2.44 billion increase in total capitalization from year-end 2008 reflected an increase in
unrealized appreciation on investment securities, net income in 2009 and the issuance of debt, partially
offset by common share repurchases, dividends to shareholders and debt maturities. The improvement
in the Company’s net unrealized gain position at December 31, 2009 over the prior year is primarily
attributable to the Company’s fixed maturity investments. The improved valuations on these holdings
reflect the changing market conditions in 2009 which included a significant narrowing of credit spreads.
122