Travelers 2009 Annual Report Download - page 93
Download and view the complete annual report
Please find page 93 of the 2009 Travelers annual report below. You can navigate through the pages in the report by either clicking on the pages listed below, or by using the keyword search tool below to find specific information within the annual report.-
 1
1 -
2
-
3
-
4
-
5
-
6
-
7
-
8
-
9
-
10
-
11
-
12
-
13
-
14
-
15
-
16
-
17
-
18
-
19
-
20
-
21
-
22
-
23
-
24
-
25
-
26
-
27
-
28
-
29
-
30
-
31
-
32
-
33
-
34
-
35
-
36
-
37
-
38
-
39
-
40
-
41
-
42
-
43
-
44
-
45
-
46
-
47
-
48
-
49
-
50
-
51
-
52
-
53
-
54
-
55
-
56
-
57
-
58
-
59
-
60
-
61
-
62
-
63
-
64
-
65
-
66
-
67
-
68
-
69
-
70
-
71
-
72
-
73
-
74
-
75
-
76
-
77
-
78
-
79
-
80
-
81
-
82
-
 83
83 -
 84
84 -
 85
85 -
 86
86 -
 87
87 -
 88
88 -
 89
89 -
 90
90 -
 91
91 -
 92
92 -
 93
93 -
 94
94 -
 95
95 -
 96
96 -
 97
97 -
 98
98 -
 99
99 -
 100
100 -
 101
101 -
 102
102 -
 103
103 -
104
-
105
-
106
-
107
-
108
-
109
-
110
-
111
-
112
-
113
-
114
-
115
-
116
-
117
-
118
-
119
-
120
-
121
-
122
-
123
-
124
-
125
-
126
-
127
-
128
-
129
-
130
-
131
-
132
-
133
-
134
-
135
-
136
-
137
-
138
-
139
-
140
-
141
-
142
-
143
-
144
-
145
-
146
-
147
-
148
-
149
-
150
-
151
-
152
-
153
-
154
-
155
-
156
-
157
-
158
-
159
-
160
-
161
-
162
-
163
-
164
-
165
-
166
-
167
-
168
-
169
-
170
-
171
-
172
-
173
-
174
-
175
-
176
-
177
-
178
-
179
-
180
-
181
-
182
-
183
-
184
-
185
-
186
-
187
-
188
-
189
-
190
-
191
-
192
-
193
-
194
-
195
-
196
-
197
-
198
-
199
-
200
-
201
-
202
-
203
-
204
-
205
-
206
-
207
-
208
-
209
-
210
-
211
-
212
-
213
-
214
-
215
-
216
-
217
-
218
-
219
-
220
-
221
-
222
-
223
-
224
-
225
-
226
-
227
-
228
-
229
-
230
-
231
-
232
-
233
-
234
-
235
-
236
-
237
-
238
-
239
-
240
-
241
-
242
-
243
-
244
-
245
-
246
-
247
-
248
-
249
-
250
-
251
-
252
-
253
-
254
-
255
-
256
-
257
-
258
-
259
-
260
-
261
-
262
-
263
-
264
-
265
-
266
-
267
-
268
-
269
-
270
-
271
-
272
-
273
-
274
-
275
-
276
-
277
-
278
-
279
-
280
-
281
-
282
-
283
-
284
-
285
-
286
-
287
-
288
-
289
-
290
-
291
-
292
-
293
-
294
-
295
 |
 |
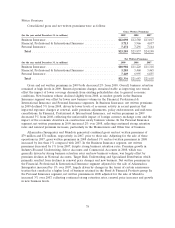
therefore, was expensed as incurred. That timing difference resulted in a benefit to income during the
2007 transition year. The impact of this change in 2007 was to lower reported expenses by $376 million
in the ‘‘General and Administrative Expenses’’ income statement line, and increase reported expenses
by $213 million in the ‘‘Amortization of Deferred Acquisition Costs’’ income statement line, compared
to what would have been reported under the prior contingent commission program.
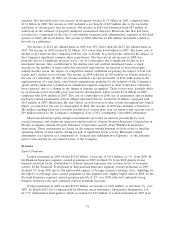
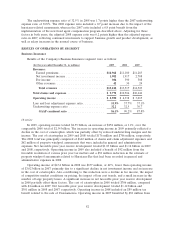
Interest Expense
Interest expense in 2009, 2008 and 2007 totaled $382 million, $370 million and $346 million,
respectively. The increases in 2009 and 2008 over the respective prior year primarily reflected higher
average levels of debt outstanding.
Effective Tax Rate
The Company’s effective tax rate was 23.1%, 21.3% and 26.0% in 2009, 2008 and 2007,
respectively. The increase in the effective rate in 2009 compared to 2008 as well as the decrease in the
effective rate in 2008 compared to 2007 primarily resulted from changes in income before taxes
between the three years and the proportion of tax-exempt investment income in each year.
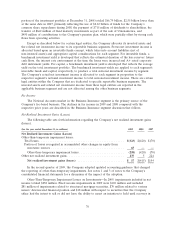
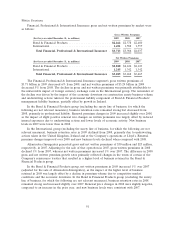
GAAP Combined Ratios
The consolidated loss and loss adjustment expense ratio of 57.3% in 2009 was 2.1 points lower
than the loss and loss adjustment expense ratio of 59.4% in 2008. The cost of catastrophes accounted
for 2.1 points of the 2009 loss and loss adjustment expense ratio, whereas the 2008 loss and loss
adjustment expense ratio included a 5.8 point impact from the cost of catastrophes. The 2009 and 2008
loss and loss adjustment expense ratios included 6.2 point and 7.1 point benefits from net favorable
prior year reserve development, respectively.
The loss and loss adjustment expense ratio adjusted for catastrophe losses and prior year reserve
development in 2009 was 0.7 points higher than the 2008 ratio on the same basis. The higher ratio in
2009 primarily reflected reduced underwriting margins related to pricing and loss cost trends in several
lines of business, partially offset by lower non-catastrophe weather-related losses and fewer large
property losses.
In 2009, the underwriting expense ratio of 31.9% was 0.6 points lower than the underwriting
expense ratio of 32.5% in 2008. The underwriting expense ratio in 2009 included a 0.4 point benefit
from the reduction in the estimate of windpool assessments described above, whereas the underwriting
expense ratio in 2008 included a 0.7 point increase due to the impact of the windpool assessments.
Adjusting for these factors in both years, the underwriting expense ratio for 2009 was 0.5 points higher
than the respective 2008 underwriting expense ratio, primarily reflecting the impact of continued
investments to support business growth and product development, including the Company’s direct to
consumer initiative in the Personal Insurance segment, as well as salary increases in the normal course
of business.
The consolidated loss and loss adjustment expense ratio of 59.4% for 2008 was 2.8 points higher
than the loss and loss adjustment expense ratio of 56.6% in 2007. The cost of catastrophes accounted
for 5.8 points of the 2008 loss and loss adjustment expense ratio, whereas the 2007 loss and loss
adjustment expense ratio included a 0.7 point impact from catastrophe losses. The 2008 and 2007 loss
and loss adjustment expense ratios included 7.1 point and 2.5 point benefits, respectively, from net
favorable prior year reserve development. The 2008 loss and loss adjustment expense ratio adjusted for
the cost of catastrophes and prior year reserve development was 2.3 points higher than the respective
2007 ratio on the same basis, reflecting the impact of competitive market conditions on pricing, a small
increase in the number of large losses, non-catastrophe weather related losses and loss cost trends.
81