Travelers 2009 Annual Report Download - page 199
Download and view the complete annual report
Please find page 199 of the 2009 Travelers annual report below. You can navigate through the pages in the report by either clicking on the pages listed below, or by using the keyword search tool below to find specific information within the annual report.-
 1
1 -
2
-
3
-
4
-
5
-
6
-
7
-
8
-
9
-
10
-
11
-
12
-
13
-
14
-
15
-
16
-
17
-
18
-
19
-
20
-
21
-
22
-
23
-
24
-
25
-
26
-
27
-
28
-
29
-
30
-
31
-
32
-
33
-
34
-
35
-
36
-
37
-
38
-
39
-
40
-
41
-
42
-
43
-
44
-
45
-
46
-
47
-
48
-
49
-
50
-
51
-
52
-
53
-
54
-
55
-
56
-
57
-
58
-
59
-
60
-
61
-
62
-
63
-
64
-
65
-
66
-
67
-
68
-
69
-
70
-
71
-
72
-
73
-
74
-
75
-
76
-
77
-
78
-
79
-
80
-
81
-
82
-
83
-
84
-
85
-
86
-
87
-
88
-
89
-
90
-
91
-
92
-
93
-
94
-
95
-
96
-
97
-
98
-
99
-
100
-
101
-
102
-
103
-
104
-
105
-
106
-
107
-
108
-
109
-
110
-
111
-
112
-
113
-
114
-
115
-
116
-
117
-
118
-
119
-
120
-
121
-
122
-
123
-
124
-
125
-
126
-
127
-
128
-
129
-
130
-
131
-
132
-
133
-
134
-
135
-
136
-
137
-
138
-
139
-
140
-
141
-
142
-
143
-
144
-
145
-
146
-
147
-
148
-
149
-
150
-
151
-
152
-
153
-
154
-
155
-
156
-
157
-
158
-
159
-
160
-
161
-
162
-
163
-
164
-
165
-
166
-
167
-
168
-
169
-
170
-
171
-
172
-
173
-
174
-
175
-
176
-
177
-
178
-
179
-
180
-
181
-
182
-
183
-
184
-
185
-
186
-
187
-
188
-
 189
189 -
 190
190 -
 191
191 -
 192
192 -
 193
193 -
 194
194 -
 195
195 -
 196
196 -
 197
197 -
 198
198 -
 199
199 -
 200
200 -
 201
201 -
 202
202 -
 203
203 -
 204
204 -
 205
205 -
 206
206 -
 207
207 -
 208
208 -
 209
209 -
210
-
211
-
212
-
213
-
214
-
215
-
216
-
217
-
218
-
219
-
220
-
221
-
222
-
223
-
224
-
225
-
226
-
227
-
228
-
229
-
230
-
231
-
232
-
233
-
234
-
235
-
236
-
237
-
238
-
239
-
240
-
241
-
242
-
243
-
244
-
245
-
246
-
247
-
248
-
249
-
250
-
251
-
252
-
253
-
254
-
255
-
256
-
257
-
258
-
259
-
260
-
261
-
262
-
263
-
264
-
265
-
266
-
267
-
268
-
269
-
270
-
271
-
272
-
273
-
274
-
275
-
276
-
277
-
278
-
279
-
280
-
281
-
282
-
283
-
284
-
285
-
286
-
287
-
288
-
289
-
290
-
291
-
292
-
293
-
294
-
295
 |
 |

THE TRAVELERS COMPANIES, INC. AND SUBSIDIARIES
NOTES TO CONSOLIDATED FINANCIAL STATEMENTS (Continued)
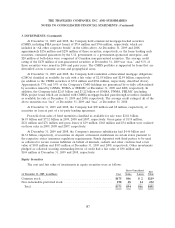
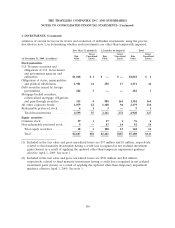
3. INVESTMENTS (Continued)
At December 31, 2009 and 2008, the Company held commercial mortgage-backed securities
(CMBS, including FHA project loans) of $714 million and $766 million, respectively, which are
included in ‘‘All other corporate bonds’’ in the tables above. At December 31, 2009 and 2008,
approximately $236 million and $258 million of these securities, respectively, or the loans backing such
securities, contained guarantees by the U.S. government or a government-sponsored enterprise, and
$20 million at both dates were comprised of Canadian non-guaranteed securities. The average credit
rating of the $478 million of non-guaranteed securities at December 31, 2009 was ‘‘Aaa,’’ and 91% of
those securities were issued in 2004 and prior years. The CMBS portfolio is supported by loans that are
diversified across economic sectors and geographical areas.
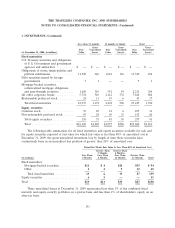
At December 31, 2009 and 2008, the Company held residential collateralized mortgage obligations
(CMOs) classified as available for sale with a fair value of $2.58 billion and $2.84 billion, respectively
(in addition to the CMBS securities of $714 million and $766 million, respectively, described above).
Approximately 37% and 35% of the Company’s CMO holdings are guaranteed by or fully collateralized
by securities issued by GNMA, FNMA or FHLMC at December 31, 2009 and 2008, respectively. In
addition, the Company held $2.63 billion and $3.22 billion of GNMA, FNMA, FHLMC (excluding
FHA project loans which are included with CMBS) mortgage-backed pass-through securities classified
as available for sale at December 31, 2009 and 2008, respectively. The average credit rating of all of the
above securities was ‘‘Aa1’’ at December 31, 2009 and ‘‘Aaa’’ at December 31, 2008.
At December 31, 2009 and 2008, the Company had $90 million and $8 million, respectively, of
securities on loan as part of a tri-party lending agreement.
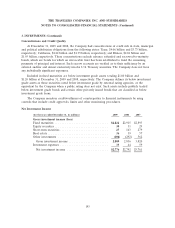
Proceeds from sales of fixed maturities classified as available for sale were $2.81 billion,
$6.93 billion and $7.32 billion in 2009, 2008 and 2007, respectively. Gross gains of $119 million,
$121 million and $76 million and gross losses of $19 million, $168 million and $34 million were realized
on those sales in 2009, 2008 and 2007, respectively.
At December 31, 2009 and 2008, the Company’s insurance subsidiaries had $4.46 billion and
$4.32 billion, respectively, of securities on deposit at financial institutions in certain states pursuant to
the respective states’ insurance regulatory requirements. Funds deposited with third parties to be used
as collateral to secure various liabilities on behalf of insureds, cedants and other creditors had a fair
value of $103 million and $105 million at December 31, 2009 and 2008, respectively. Other investments
pledged as collateral securing outstanding letters of credit had a fair value of $98 million and
$104 million at December 31, 2009 and 2008, respectively.
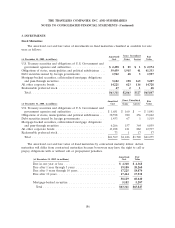
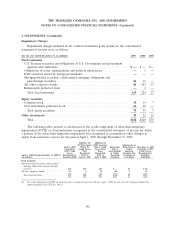
Equity Securities
The cost and fair value of investments in equity securities were as follows:
Gross Unrealized Fair
(at December 31, 2009, in millions) Cost Gains Losses Value
Common stock......................................... $175 $46 $ 2 $219
Non-redeemable preferred stock . . . . . . . . . . . . . . . . . . . . . . . . . . . . 198 48 14 232
Total............................................... $373 $94 $16 $451
187