Travelers 2009 Annual Report Download - page 86
Download and view the complete annual report
Please find page 86 of the 2009 Travelers annual report below. You can navigate through the pages in the report by either clicking on the pages listed below, or by using the keyword search tool below to find specific information within the annual report.-
 1
1 -
2
-
3
-
4
-
5
-
6
-
7
-
8
-
9
-
10
-
11
-
12
-
13
-
14
-
15
-
16
-
17
-
18
-
19
-
20
-
21
-
22
-
23
-
24
-
25
-
26
-
27
-
28
-
29
-
30
-
31
-
32
-
33
-
34
-
35
-
36
-
37
-
38
-
39
-
40
-
41
-
42
-
43
-
44
-
45
-
46
-
47
-
48
-
49
-
50
-
51
-
52
-
53
-
54
-
55
-
56
-
57
-
58
-
59
-
60
-
61
-
62
-
63
-
64
-
65
-
66
-
67
-
68
-
69
-
70
-
71
-
72
-
73
-
74
-
75
-
 76
76 -
 77
77 -
 78
78 -
 79
79 -
 80
80 -
 81
81 -
 82
82 -
 83
83 -
 84
84 -
 85
85 -
 86
86 -
 87
87 -
 88
88 -
 89
89 -
 90
90 -
 91
91 -
 92
92 -
 93
93 -
 94
94 -
 95
95 -
 96
96 -
97
-
98
-
99
-
100
-
101
-
102
-
103
-
104
-
105
-
106
-
107
-
108
-
109
-
110
-
111
-
112
-
113
-
114
-
115
-
116
-
117
-
118
-
119
-
120
-
121
-
122
-
123
-
124
-
125
-
126
-
127
-
128
-
129
-
130
-
131
-
132
-
133
-
134
-
135
-
136
-
137
-
138
-
139
-
140
-
141
-
142
-
143
-
144
-
145
-
146
-
147
-
148
-
149
-
150
-
151
-
152
-
153
-
154
-
155
-
156
-
157
-
158
-
159
-
160
-
161
-
162
-
163
-
164
-
165
-
166
-
167
-
168
-
169
-
170
-
171
-
172
-
173
-
174
-
175
-
176
-
177
-
178
-
179
-
180
-
181
-
182
-
183
-
184
-
185
-
186
-
187
-
188
-
189
-
190
-
191
-
192
-
193
-
194
-
195
-
196
-
197
-
198
-
199
-
200
-
201
-
202
-
203
-
204
-
205
-
206
-
207
-
208
-
209
-
210
-
211
-
212
-
213
-
214
-
215
-
216
-
217
-
218
-
219
-
220
-
221
-
222
-
223
-
224
-
225
-
226
-
227
-
228
-
229
-
230
-
231
-
232
-
233
-
234
-
235
-
236
-
237
-
238
-
239
-
240
-
241
-
242
-
243
-
244
-
245
-
246
-
247
-
248
-
249
-
250
-
251
-
252
-
253
-
254
-
255
-
256
-
257
-
258
-
259
-
260
-
261
-
262
-
263
-
264
-
265
-
266
-
267
-
268
-
269
-
270
-
271
-
272
-
273
-
274
-
275
-
276
-
277
-
278
-
279
-
280
-
281
-
282
-
283
-
284
-
285
-
286
-
287
-
288
-
289
-
290
-
291
-
292
-
293
-
294
-
295
 |
 |
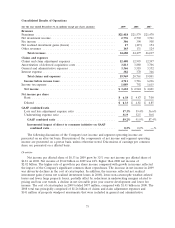
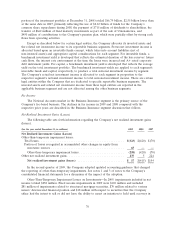
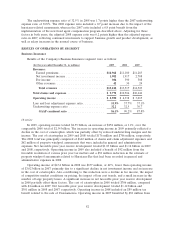
expenses. Net favorable prior year reserve development totaled $1.33 billion in 2009, compared with
$1.54 billion in 2008. Net income in 2009 included a net benefit of $89 million due to the favorable
resolution of various prior year tax matters. Net income in 2009 also benefited from $87 million of
reductions in the estimate of property windpool assessments related to Hurricane Ike that had been
recorded as a component of the cost of catastrophes in general and administrative expenses in the third
quarter of 2008 (discussed below). Net income in 2008 reflected an $89 million tax benefit related to
the sale of a subsidiary.
Net income of $4.81 per diluted share in 2008 was 30% lower than the $6.85 per diluted share in
2007. Net income in 2008 totaled $2.92 billion, 36% lower than $4.60 billion in 2007. The lower rate of
decline in per share income compared with the rate of decline in actual income reflected the impact of
the Company’s significant common share repurchases. The decrease in net income in 2008 was
primarily due to a significant increase in the cost of catastrophes and a significant decline in net
investment income. Also contributing to the decline were net realized investment losses, a small
increase in the number of large losses that exceeded expectations, an increase in non-catastrophe
related weather losses, the impact of competitive market conditions on pricing, the impact of loss cost
trends and a decline in fee income. Net income in 2008 reflected an $89 million tax benefit related to
the sale of a subsidiary. In 2007, net income included a net pretax benefit of $163 million due to the
implementation of a new fixed, value-based compensation program for the majority of the Company’s
agents which resulted in a reduction in commission expense compared to what would have otherwise
been reported, due to a change in the timing of expense recognition. These factors were partially offset
by an increase in net favorable prior year reserve development, which totaled $1.54 billion in 2008,
compared with $546 million in 2007. The cost of catastrophes in 2008, net of reinsurance and including
hurricane-related assessments of $141 million (discussed below), totaled $1.41 billion, compared with
$167 million in 2007. Hurricanes Ike and Gustav, as well as several other storms throughout the United
States, accounted for the cost of catastrophes in 2008. Net income in 2007 also included a benefit of
$86 million resulting from the favorable resolution of various prior year tax matters and a pretax loss of
$39 million related to the Company’s redemption of its 4.50% contingently convertible debentures.
Hurricane-related property windpool assessments are levied on insurers periodically by state-
created insurance and windstorm insurance entities such as Citizens Property Insurance Corporation in
Florida, Louisiana Citizens Property Insurance Corporation and the Texas Windstorm Insurance
Association. These assessments are levied on the insurers writing business in those states to fund the
operating deficits of such entities during periods of significant storm activity. Hurricane-related
assessments are reported as a component of ‘‘General and Administrative Expenses’’ as the amounts
paid to such entities are not insured losses of the Company.
Revenues
Earned Premiums
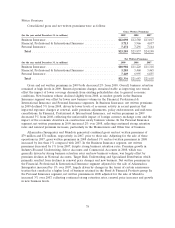
Earned premiums in 2009 totaled $21.42 billion, a decrease of $161 million, or 1%, from 2008. In
the Business Insurance segment, earned premiums in 2009 declined 2% from 2008 despite strong
business retention levels, attributable to reduced insured exposures due to lower levels of economic
activity. In the Financial, Professional & International Insurance segment, earned premiums in 2009
declined 3% from 2008 due to the unfavorable impact of foreign currency exchange rates. Adjusting for
the impact of exchange rates, earned premiums in this segment were slightly higher than in 2008. In the
Personal Insurance segment, earned premium growth of 2% over 2008 reflected continued strong
business retention rates and continued renewal premium increases.
Earned premiums in 2008 totaled $21.58 billion, an increase of $109 million, or less than 1%, over
2007. In March 2007, the Company sold its Mexican surety subsidiary, Afianzadora Insurgentes, S.A.
de C.V. (Afianzadora Insurgentes), which accounted for $27 million of earned premiums in 2007 prior
74