Travelers 2009 Annual Report Download - page 130
Download and view the complete annual report
Please find page 130 of the 2009 Travelers annual report below. You can navigate through the pages in the report by either clicking on the pages listed below, or by using the keyword search tool below to find specific information within the annual report.-
 1
1 -
2
-
3
-
4
-
5
-
6
-
7
-
8
-
9
-
10
-
11
-
12
-
13
-
14
-
15
-
16
-
17
-
18
-
19
-
20
-
21
-
22
-
23
-
24
-
25
-
26
-
27
-
28
-
29
-
30
-
31
-
32
-
33
-
34
-
35
-
36
-
37
-
38
-
39
-
40
-
41
-
42
-
43
-
44
-
45
-
46
-
47
-
48
-
49
-
50
-
51
-
52
-
53
-
54
-
55
-
56
-
57
-
58
-
59
-
60
-
61
-
62
-
63
-
64
-
65
-
66
-
67
-
68
-
69
-
70
-
71
-
72
-
73
-
74
-
75
-
76
-
77
-
78
-
79
-
80
-
81
-
82
-
83
-
84
-
85
-
86
-
87
-
88
-
89
-
90
-
91
-
92
-
93
-
94
-
95
-
96
-
97
-
98
-
99
-
100
-
101
-
102
-
103
-
104
-
105
-
106
-
107
-
108
-
109
-
110
-
111
-
112
-
113
-
114
-
115
-
116
-
117
-
118
-
119
-
 120
120 -
 121
121 -
 122
122 -
 123
123 -
 124
124 -
 125
125 -
 126
126 -
 127
127 -
 128
128 -
 129
129 -
 130
130 -
 131
131 -
 132
132 -
 133
133 -
 134
134 -
 135
135 -
 136
136 -
 137
137 -
 138
138 -
 139
139 -
 140
140 -
141
-
142
-
143
-
144
-
145
-
146
-
147
-
148
-
149
-
150
-
151
-
152
-
153
-
154
-
155
-
156
-
157
-
158
-
159
-
160
-
161
-
162
-
163
-
164
-
165
-
166
-
167
-
168
-
169
-
170
-
171
-
172
-
173
-
174
-
175
-
176
-
177
-
178
-
179
-
180
-
181
-
182
-
183
-
184
-
185
-
186
-
187
-
188
-
189
-
190
-
191
-
192
-
193
-
194
-
195
-
196
-
197
-
198
-
199
-
200
-
201
-
202
-
203
-
204
-
205
-
206
-
207
-
208
-
209
-
210
-
211
-
212
-
213
-
214
-
215
-
216
-
217
-
218
-
219
-
220
-
221
-
222
-
223
-
224
-
225
-
226
-
227
-
228
-
229
-
230
-
231
-
232
-
233
-
234
-
235
-
236
-
237
-
238
-
239
-
240
-
241
-
242
-
243
-
244
-
245
-
246
-
247
-
248
-
249
-
250
-
251
-
252
-
253
-
254
-
255
-
256
-
257
-
258
-
259
-
260
-
261
-
262
-
263
-
264
-
265
-
266
-
267
-
268
-
269
-
270
-
271
-
272
-
273
-
274
-
275
-
276
-
277
-
278
-
279
-
280
-
281
-
282
-
283
-
284
-
285
-
286
-
287
-
288
-
289
-
290
-
291
-
292
-
293
-
294
-
295
 |
 |
Cash flows in 2008 reflected an increase in claim payments (including the impact of higher
catastrophe losses and the $365 million net asbestos settlement payment related to ACandS, Inc.) and a
reduction in reinsurance recoveries compared with 2007. In addition, the Company made a $450 million
contribution to its pension plan in 2008. No pension plan contribution was made in 2007. Cash flows in
2007 reflected higher levels of collected premiums and net investment income, lower claim payments on
catastrophe losses, as well as lower runoff claim payments. Cash flows from operations in 2007
benefited from significant collections on reinsurance recoverables in both years, including those related
to 2005 hurricane losses, operations in runoff (primarily Gulf) and various commutation agreements.
These factors were partially offset by an increase in tax payments in 2007 resulting from higher
profitability, expenses related to increased business volume and continued expenditures to support
business growth and product development, and higher interest payments.
Investing Activities
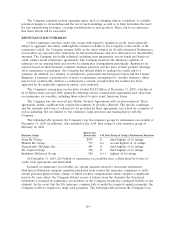
Net cash flows used in investing activities totaled $899 million, $162 million and $2.53 billion in
2009, 2008 and 2007, respectively. Fixed maturity securities accounted for the majority of investment
purchases in all three years. Net cash available for use in investing activities in 2009 was principally
provided by $4.23 billion of cash flows from operating activities, partially offset by $3.44 billion of cash
used in financing activities (principally $3.29 billion for common share repurchases). In 2008,
substantially all of the $3.14 billion in cash provided by operating activities was deployed for financing
activities, principally for $2.20 billion of common share repurchases.
The Company’s consolidated total investments at December 31, 2009 increased by $4.23 billion
from year-end 2008, primarily reflecting a $3.08 billion pretax increase in the unrealized appreciation of
investments since year-end 2008 and investment purchases resulting from strong cash flows from
operations, partially offset by $3.29 billion of common share repurchases made during 2009. The
improvement in the Company’s net unrealized investment gain position at December 31, 2009 over the
prior year is primarily attributable to the Company’s fixed maturity investments. The improved
valuations on these holdings reflect the changing market conditions in 2009 which included a significant
narrowing of credit spreads.
The Company’s management of the duration of the fixed maturity investment portfolio generally
produces a duration that exceeds the estimated duration of the Company’s net insurance liabilities. The
average duration of fixed maturities and short-term securities was 3.9 (4.2 excluding short-term
securities) at December 31, 2009 and 4.2 (4.6 excluding short-term securities) at December 31, 2008.
The decline in duration resulted from the impact of declining market yields on existing holdings of
municipal bonds and mortgage-backed securities (which impact the assumptions related to optional
pre-payments and the related estimate of effective duration for callable securities), and the purchase of
shorter-term fixed maturities during the second half of 2009.
The primary goals of the Company’s asset liability management process are to satisfy the insurance
liabilities, manage the interest rate risk embedded in those insurance liabilities and maintain sufficient
liquidity to cover fluctuations in projected liability cash flows. Generally, the expected principal and
interest payments produced by the Company’s fixed maturity portfolio adequately fund the estimated
runoff of the Company’s insurance reserves. Although this is not an exact cash flow match in each
period, the substantial degree by which the market value of the fixed maturity portfolio exceeds the
expected present value of the net insurance liabilities, as well as the positive cash flow from newly sold
policies and the large amount of high quality liquid bonds, provide assurance of the Company’s ability
to fund claim payments without having to sell illiquid assets or access credit facilities.
118